Answered step by step
Verified Expert Solution
Question
1 Approved Answer
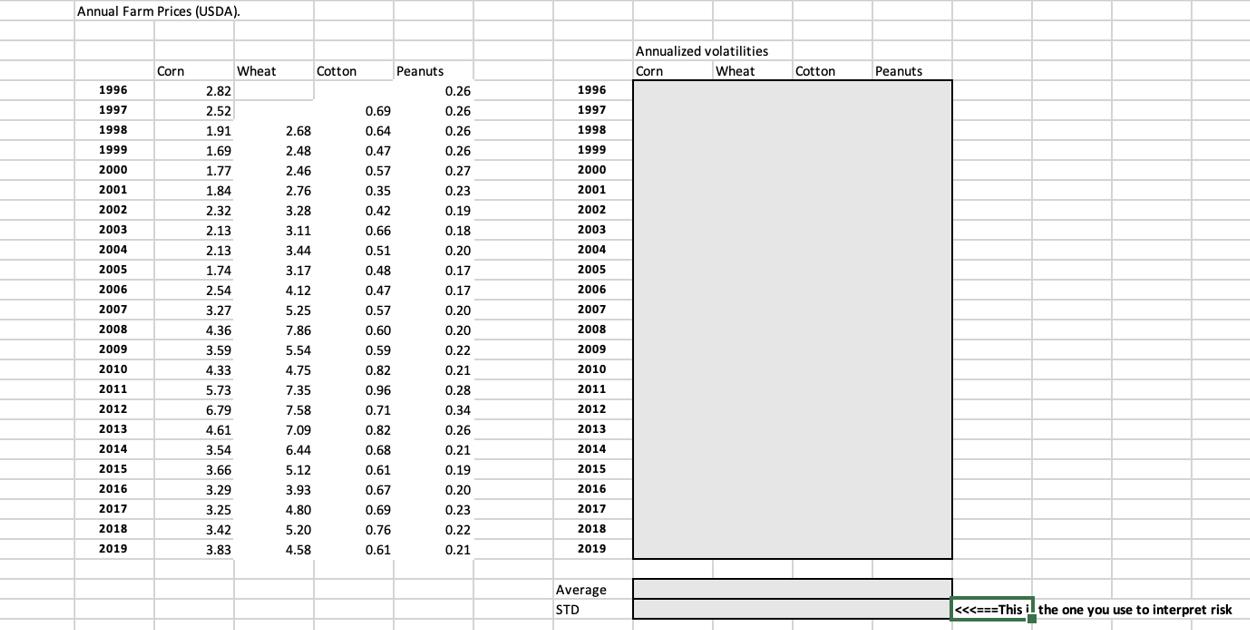
Calculate the average annual price volatility. Which crop has the highest annual volatility? Annual Farm Prices (USDA). 1996 1997 1998 1999 2000 2001 2002 2003
Calculate the average annual price volatility. Which crop has the highest annual volatility?
Annual Farm Prices (USDA). 1996 1997 1998 1999 2000 2001 2002 2003 2004 2005 2006 2007 2008 2009 2010 2011 2012 2013 2014 2015 2016 2017 2018 2019 Corn 2.82 2.52 1.91 1.69 1.77 1.84 2.32 2.13 2.13 1.74 2.54 3.27 4.36 3.59 4.33 5.73 6.79 4.61 3.54 3.66 3.29 3.25 3.42 3.83 Wheat 2.68 2.48 2.46 2.76 3.28 3.11 3.44 3.17 4.12 5.25 7.86 5.54 4.75 7.35 7.58 7.09 6.44 5.12 3.93 4.80 5.20 4.58 Cotton 0.69 0.64 0.47 0.57 0.35 0.42 0.66 0.51 0.48 0.47 0.57 0.60 0.59 0.82 0.96 0.71 0.82 0.68 0.61 0.67 0.69 0.76 0.61 Peanuts 0.26 0.26 0.26 0.26 0.27 0.23 0.19 0.18 0.20 0.17 0.17 0.20 0.20 0.22 0.21 0.28 0.34 0.26 0.21 0.19 0.20 0.23 0.22 0.21 1996 1997 1998 1999 2000 2001 2002 2003 2004 2005 2006 2007 2008 2009 2010 2011 2012 2013 2014 2015 2016 2017 2018 2019 Average STD Annualized volatilities Corn Wheat Cotton Peanuts <
Step by Step Solution
★★★★★
3.44 Rating (151 Votes )
There are 3 Steps involved in it
Step: 1

Get Instant Access to Expert-Tailored Solutions
See step-by-step solutions with expert insights and AI powered tools for academic success
Step: 2

Step: 3

Ace Your Homework with AI
Get the answers you need in no time with our AI-driven, step-by-step assistance
Get Started


