

Answered step by step
Verified Expert Solution
Question
1 Approved Answer
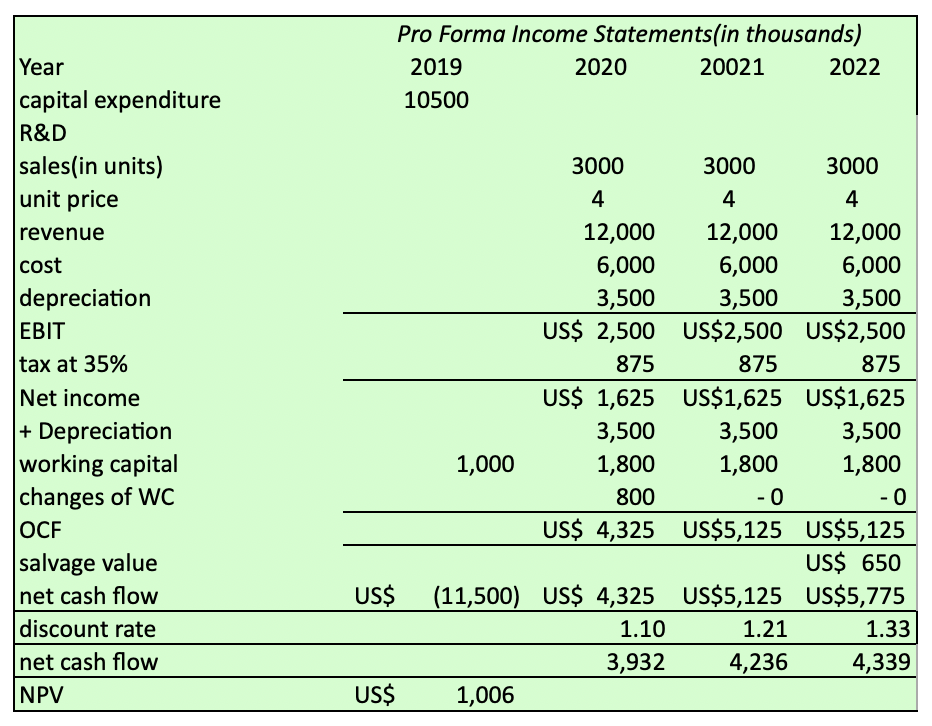
Calculate the Breakeven Analysis using: Pro Forma Income Statements(in thousands) 2019 2020 20021 2022 10500 Year capital expenditure R&D sales(in units) unit price revenue cost
Calculate the Breakeven Analysis using:
Step by Step Solution
There are 3 Steps involved in it
Step: 1

Get Instant Access to Expert-Tailored Solutions
See step-by-step solutions with expert insights and AI powered tools for academic success
Step: 2

Step: 3
Ace Your Homework with AI
Get the answers you need in no time with our AI-driven, step-by-step assistance
Get Started
Regulation A+ And Other Alternatives To A Traditional IPO Financing Your Growth Business Following The JOBS Act
Authors: David N. Feldman
1st Edition
1119416159,1119416124