Answered step by step
Verified Expert Solution
Question
1 Approved Answer
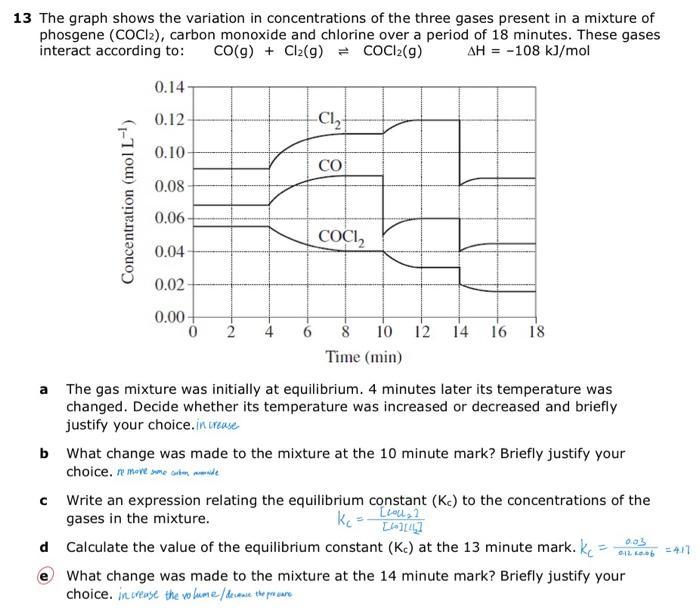
13 The graph shows the variation in concentrations of the three gases present in a mixture of phosgene (COCI2), carbon monoxide and chlorine over

13 The graph shows the variation in concentrations of the three gases present in a mixture of phosgene (COCI2), carbon monoxide and chlorine over a period of 18 minutes. These gases interact according to: CO(g) + Cl(g) = COCl2(g) AH = -108 kJ/mol Concentration (mol L-) 0.14- 0.12- 0.10 0.08- 0.06- 0.04- 0.02- 0.00+ 0 2 -C CO COCI2 10 12 14 16 18 Time (min) a The gas mixture was initially at equilibrium. 4 minutes later its temperature was changed. Decide whether its temperature was increased or decreased and briefly justify your choice.increase b What change was made to the mixture at the 10 minute mark? Briefly justify your choice. remove me tende Write an expression relating the equilibrium constant (Kc) to the concentrations of the gases in the mixture. kc [lol] [4][44] d Calculate the value of the equilibrium constant (Kc) at the 13 minute mark. k 0.03 012 60.06 What change was made to the mixture at the 14 minute mark? Briefly justify your choice. increase the volume / decause the procure = 4.17
Step by Step Solution
★★★★★
3.53 Rating (150 Votes )
There are 3 Steps involved in it
Step: 1

Get Instant Access to Expert-Tailored Solutions
See step-by-step solutions with expert insights and AI powered tools for academic success
Step: 2

Step: 3

Ace Your Homework with AI
Get the answers you need in no time with our AI-driven, step-by-step assistance
Get Started


