Answered step by step
Verified Expert Solution
Question
1 Approved Answer
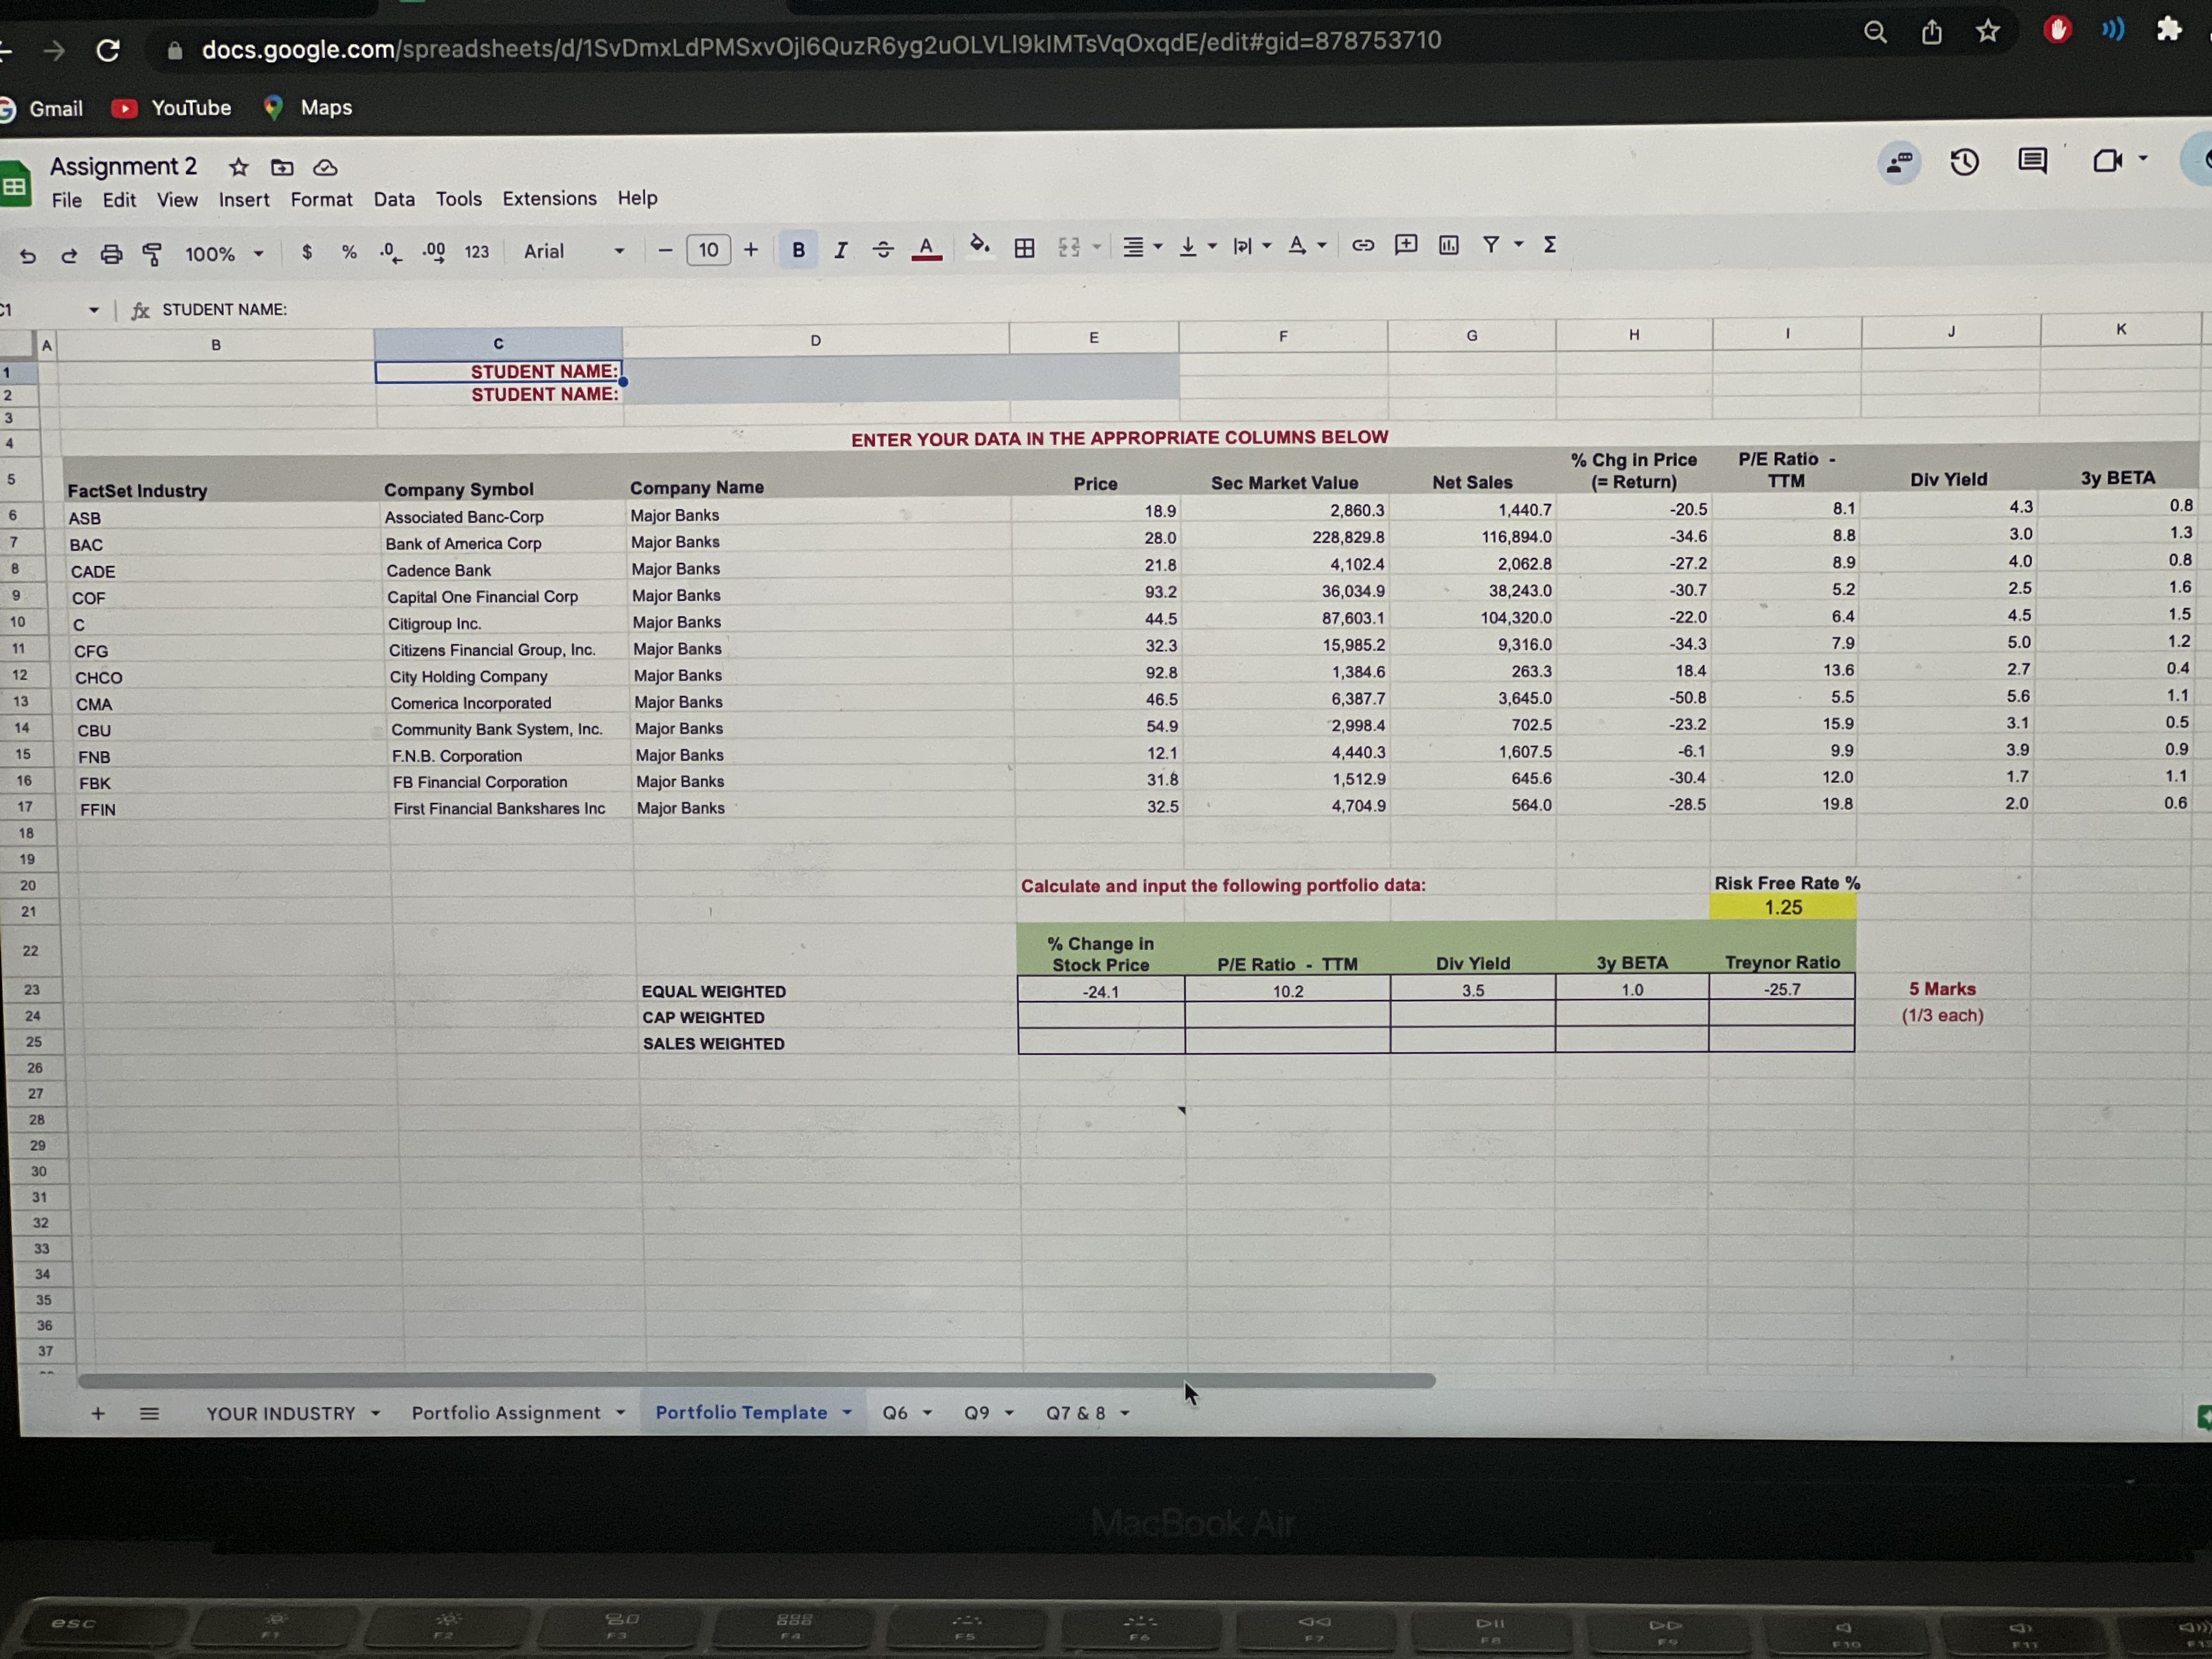
Calculate the data highlighted in green, based on 3 portfolios containing your companies using 3 different weightings. Equal weighting (assumes the investor invests an equal
Calculate the data highlighted in green, based on 3 portfolios containing your companies using 3 different weightings. Equal weighting (assumes the investor invests an equal % of her assets in each stock) Market value weighting (assumes the investor's allocation to each stock is that stock's market capitalization as a % of the entire portfolio's market capitalization) Company Net Sales weighting (assumes the investor's allocation to each stock is that stock's Net Sales as a % of the Net Sales of all stocks in the portfolio combined

- 8.8 C1 1 2 3 4 5 6 7 8 Gmail 9 10 11 12 13 14 15 16 17 18 19 20 21 22 A 23 24 25 26 27 28 29 2 30 31 32 33 34 35 36 37 Assignment 2 File Edit View Insert Format Data Tools Extensions Help docs.google.com/spreadsheets/d/1SvDmxLdPMSxvOjl6QuzR6yg2uOLVLI9KIMTsVqOxqdE/edit#gid=878753710 YouTube CFG CHCO CMA CBU FNB FBK FFIN fx STUDENT NAME: FactSet Industry ASB BAC CADE COF C + = esc 100% - Maps B $ % .0 .00 123 Arial YOUR INDUSTRY Y C STUDENT NAME: STUDENT NAME: Company Symbol Associated Banc-Corp Bank of America Corp Cadence Bank Capital One Financial Corp Citigroup Inc. Citizens Financial Group, Inc. City Holding Company Comerica Incorporated Community Bank System, Inc. F.N.B. Corporation FB Financial Corporation First Financial Bankshares Inc Portfolio Assignment Y 1 20 F3 10 + Company Name Major Banks Major Banks Major Banks Major Banks Major Banks Major Banks Major Banks Major Banks Major Banks Major Banks Major Banks Major Banks EQUAL WEIGHTED CAP WEIGHTED SALES WEIGHTED B I A D Portfolio Template 888 FA Y Q6 - Q9 - 88 23 ENTER YOUR DATA IN THE APPROPRIATE COLUMNS BELOW F5 E Price 18.9 28.0 21.8 93.2 44.5 32.3 92.8 46.5 54.9 12.1 31.8 32.5 % Change in Stock Price -24.1 PAG Q7 & 8 Calculate and input the following portfolio data: Sec Market Value 2,860.3 228,829.8 4,102.4 36,034.9 87,603.1 15,985.2 1,384.6 6,387.7 2,998.4 4,440.3 1,512.9 4,704.9 P/E Ratio TTM 10.2 MacBook Air - + QQ F7 [ - G Net Sales 1,440.7 116,894.0 2,062.8 38,243.0 104,320.0 9,316.0 263.3 3,645.0 702.5 1,607.5 645.6 564.0 Div Yield 3.5 DII H %Chg in Price (= Return) 3y BETA 1.0 -20.5 -34.6 -27.2 -30.7 -22.0 -34.3 18.4 -50.8 -23.2 -6.1 -30.4 -28.5 P/E Ratio TTM 8.1 8.8 8.9 5.2 6.4 7.9 13.6 5.5 15.9 9.9 12.0 19.8 Risk Free Rate % 1.25 Treynor Ratio -25.7 F10 Q Div Yield 5 Marks (1/3 each) 4.3 3.0 4.0 2.5 4.5 5.0 2.7 5.6 3.1 3.9 1.7 2.0 F1T K 3y BETA 0.8 1.3 0.8 1.6 1.5 1.2 0.4 1.1 0.5 0.9 1.1 0.6 ()))
Step by Step Solution
There are 3 Steps involved in it
Step: 1
Certainly lets use values for the market capitalizations Mcap and net sales NS of three companies in ...
Get Instant Access to Expert-Tailored Solutions
See step-by-step solutions with expert insights and AI powered tools for academic success
Step: 2

Step: 3

Ace Your Homework with AI
Get the answers you need in no time with our AI-driven, step-by-step assistance
Get Started


