

Answered step by step
Verified Expert Solution
Question
1 Approved Answer
Calculate the Dupont Analysis ratios for 2003 and 2004. explain your findings. DuPont Analysis FALLHALANI DuPont Analysis Net Profit Margin (NPM)- Net Income/Sales Total Asset
Calculate the Dupont Analysis ratios for 2003 and 2004. explain your findings. 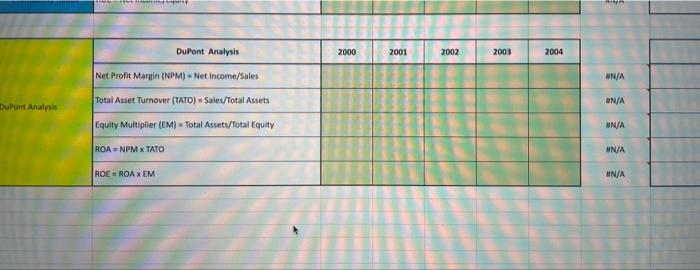
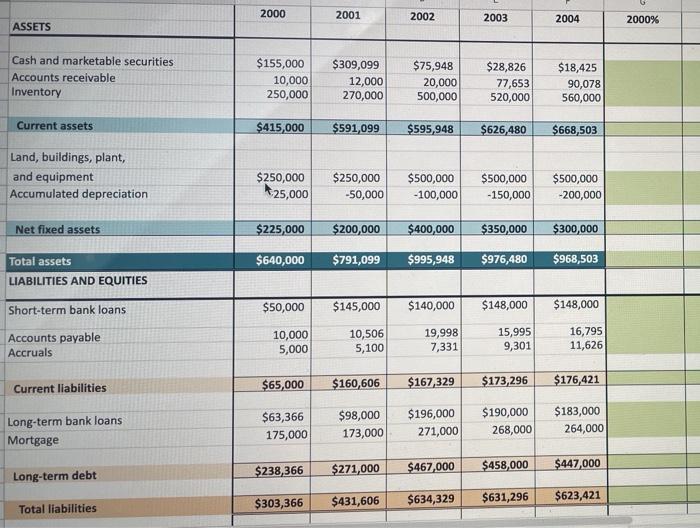
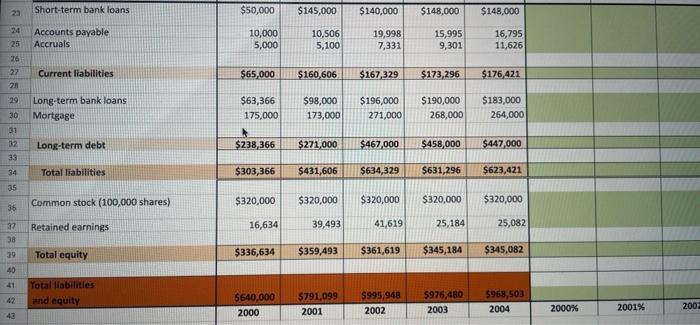
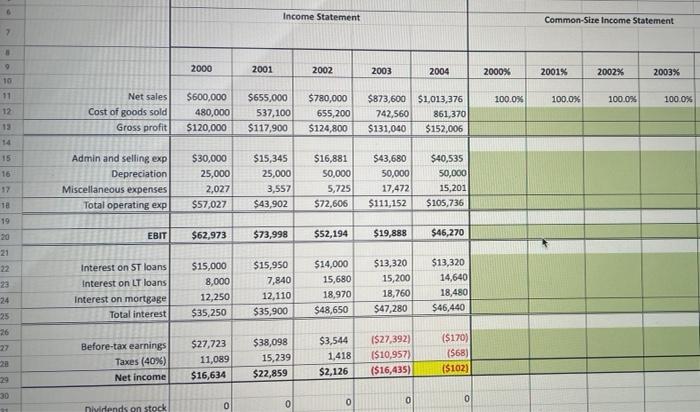
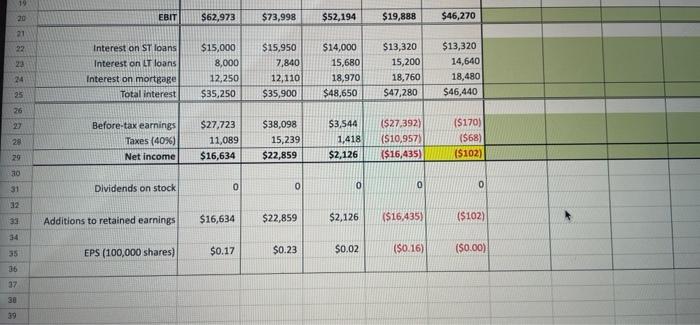 DuPont Analysis FALLHALANI DuPont Analysis Net Profit Margin (NPM)- Net Income/Sales Total Asset Turnover (TATO) = Sales/Total Assets Equity Multiplier (EM) = Total Assets/Total Equity ROA=NPM x TATO ROE-ROA X EM 2000 2001 2002 2003 2004 REM #N/A #N/A #N/A UN/A #N/A ASSETS Cash and marketable securities Accounts receivable Inventory Current assets Land, buildings, plant, and equipment Accumulated depreciation Net fixed assets Total assets LIABILITIES AND EQUITIES Short-term bank loans Accounts payable Accruals Current liabilities Long-term bank loans Mortgage Long-term debt Total liabilities 2000 $155,000 10,000 250,000 $415,000 $250,000 25,000 $225,000 $640,000 $50,000 10,000 5,000 $65,000 $63,366 175,000 $238,366 $303,366 2001 2002 2003 2004 $309,099 $75,948 $28,826 $18,425 12,000 20,000 77,653 90,078 270,000 500,000 520,000 560,000 $591,099 $595,948 $626,480 $668,503 $250,000 $500,000 $500,000 $500,000 -50,000 -100,000 -150,000 -200,000 $200,000 $400,000 $350,000 $300,000 $791,099 $995,948 $976,480 $968,503 $145,000 $140,000 $148,000 $148,000 10,506 19,998 15,995 16,795 5,100 7,331 9,301 11,626 $167,329 $173,296 $176,421 $196,000 $190,000 $183,000 271,000 268,000 $271,000 $467,000 $458,000 $431,606 $634,329 $631,296 $160,606 $98,000 173,000 264,000 $447,000 $623,421 2000% ***NAR582322999 24 26 27 211 30 31 33 34 36 37 40 42 43 Short-term bank loans. Accounts payable Accruals Current liabilities Long-term bank loans Mortgage Long-term debt Total liabilities Common stock (100,000 shares) Retained earnings Total equity Total liabilities and equity $50,000 10,000 5,000 $145,000 $140,000 $148,000 10,506 19,998 15,995 5,100 7,331 9,301 $160,606 $167,329 $173,296 $98,000 175,000 173,000 $238,366 $271,000 $303,366 $431,606 $320,000 $320,000 16,634 39,493 $336,634 $359,493 $791,099 $640,000 2000 2001 $148,000 16,795 11,626 $176,421 $196,000 $190,000 $183,000 271,000 268,000 264,000 $467,000 $458,000 $447,000 $634,329 $631,296 $623,421 $320,000 $320,000 $320,000 41,619 25,184 25,082 $361,619 $345,184 $345,082 $995,948 $976,480 $968,503 2002 2003 2004 $65,000 $63,366 2000% 2001% 200 6 7 8 9 10 11 12 13 14 15 16 17 18 19 20 21 23 24 25 26 27 28 29 30 M Net sales Cost of goods sold Gross profit Admin and selling exp Depreciation Miscellaneous expenses Total operating exp EBIT Interest on ST loans Interest on LT loans Interest on mortgage Total interest Before-tax earnings Taxes (40%) Net income Dividends on stock 2000 $600,000 480,000 $120,000 $30,000 25,000 2,027 $57,027 $62,973 $15,000 8,000 12,250 $35,250 $27,723 11,089 $16,634 0 Income Statement 2002 2003 2004 $780,000 $873,600 $1,013,376 655,200 742,560 861,370 $124,800 $131,040 $152,006 $16,881 $43,680 $40,535 50,000 50,000 5,725 17,472 $72,606 $111,152 $52,194 $19,888 $14,000 $13,320 2001 $655,000 537,100 $117,900 $15,345 25,000 3,557 $43,902 $73,998 $15,950 7,840 15,680 12,110) 18,970 $35,900 $48,650 $38,098 $3,544 15,239 $22,859 0 1,418 $2,126 0 15,200 18,760 $47,280 ($27,392) ($10,957) ($16,435) 0 50,000 15,201 $105,736 $46,270 $13,320 14,640 18,480 $46,440 ($170) (568) ($102) 0 2000% 100.0% Common-Size Income Statement 2001% 2002% 2003% 100.0% 100.0% 100.0% 20 21 22 23 24 25 19 26 27 28 29 30 31 32525255 33 34 36 37 30 39 EBIT Interest on ST loans Interest on LT loans Interest on mortgage Total interest Before-tax earnings Taxes (40%) Net income Dividends on stock Additions to retained earnings EPS (100,000 shares) $62,973 $15,000 8,000 12,250 $35,250 $27,723 11,089 $16,634 $16,634 $0.17 0 $73,998 $15,950 7,840 12,110 $35,900 $38,098 15,239 $22,859 0 $22,859 $0.23 $52,194 $14,000 15,680 18,970 $48,650 $3,544 1,418 $2,126 0 $2,126 $0.02 $19,888 $46,270 $13,320 $13,320 15,200 14,640 18,760 18,480 $47,280 $46,440 ($27,392) ($170) ($10,957) ($68) ($16,435) ($102) 0 0 ($16,435) ($102) ($0.16) ($0.00)
Step by Step Solution
There are 3 Steps involved in it
Step: 1

Get Instant Access with AI-Powered Solutions
See step-by-step solutions with expert insights and AI powered tools for academic success
Step: 2

Step: 3
Ace Your Homework with AI
Get the answers you need in no time with our AI-driven, step-by-step assistance
Get Started