Answered step by step
Verified Expert Solution
Question
1 Approved Answer
Calculate the financial ratio for the years 2020 and show the calculations in table with the following ratio categories: 1. Liquidity ratio 2. activity/ efficiency
Calculate the financial ratio for the years 2020 and show the calculations in table with the following ratio categories:
1. Liquidity ratio 2. activity/ efficiency ratio 3. leverage/debt ratio
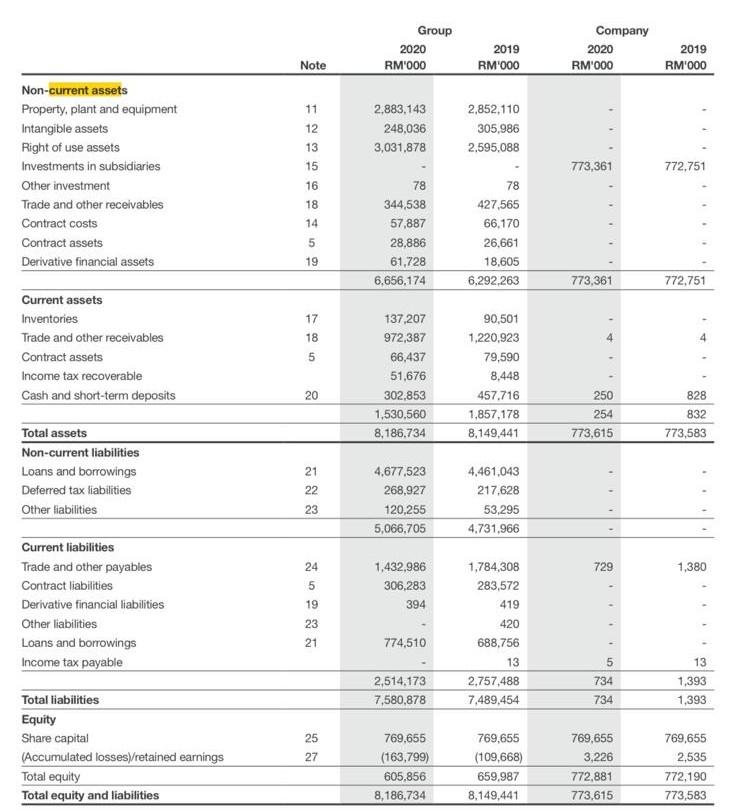
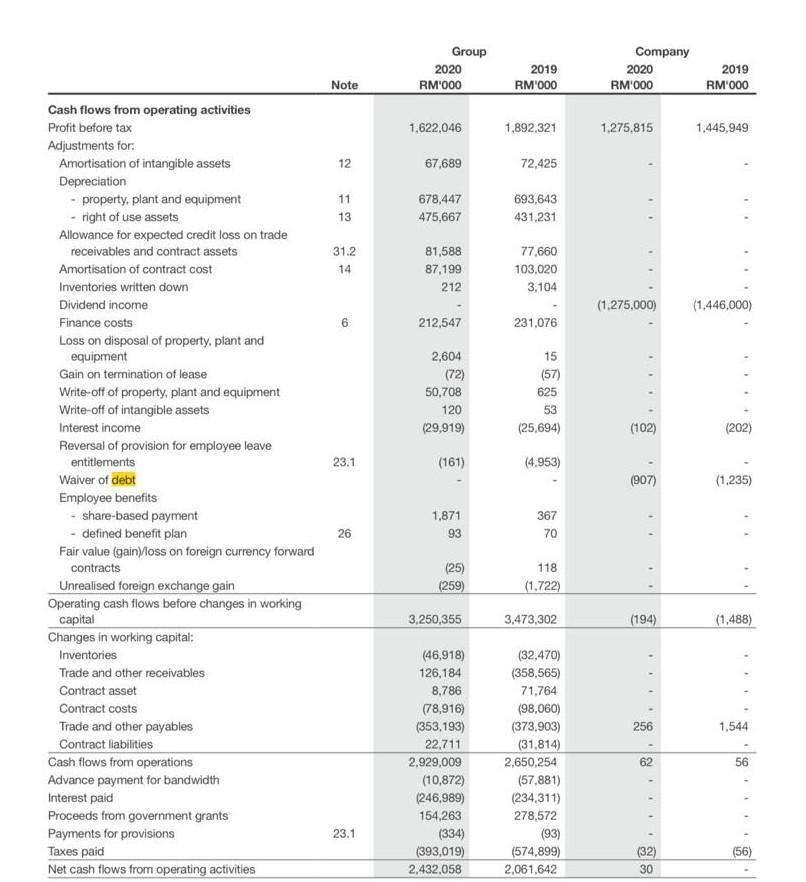
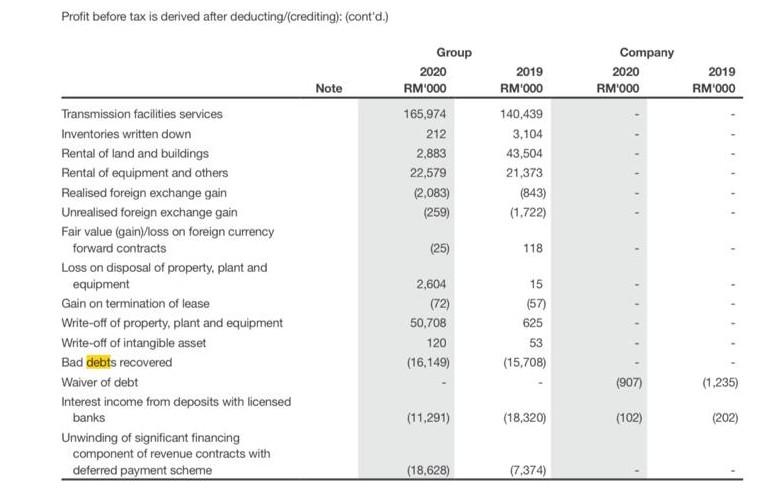
Calculate the financial ratio and show the calculations with the following categories: 1. Liquidity ratio 2. Efficiency ratio 3. Leverage/ Debt ratio
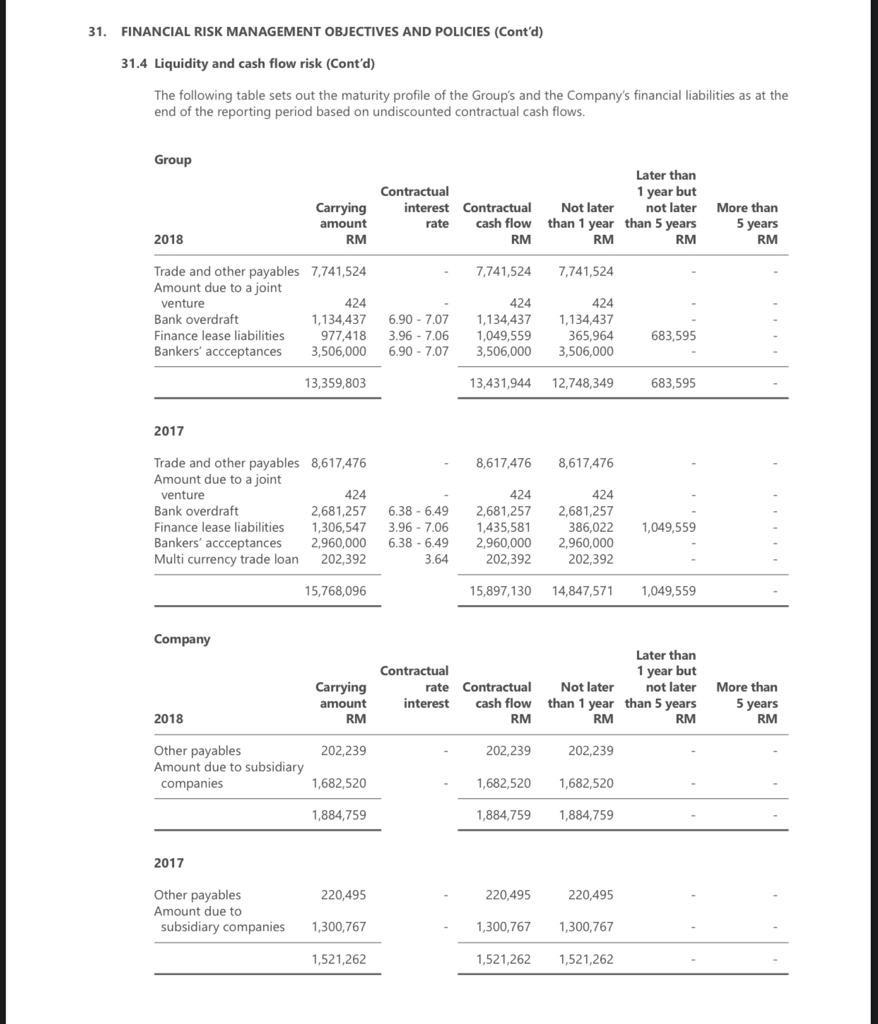
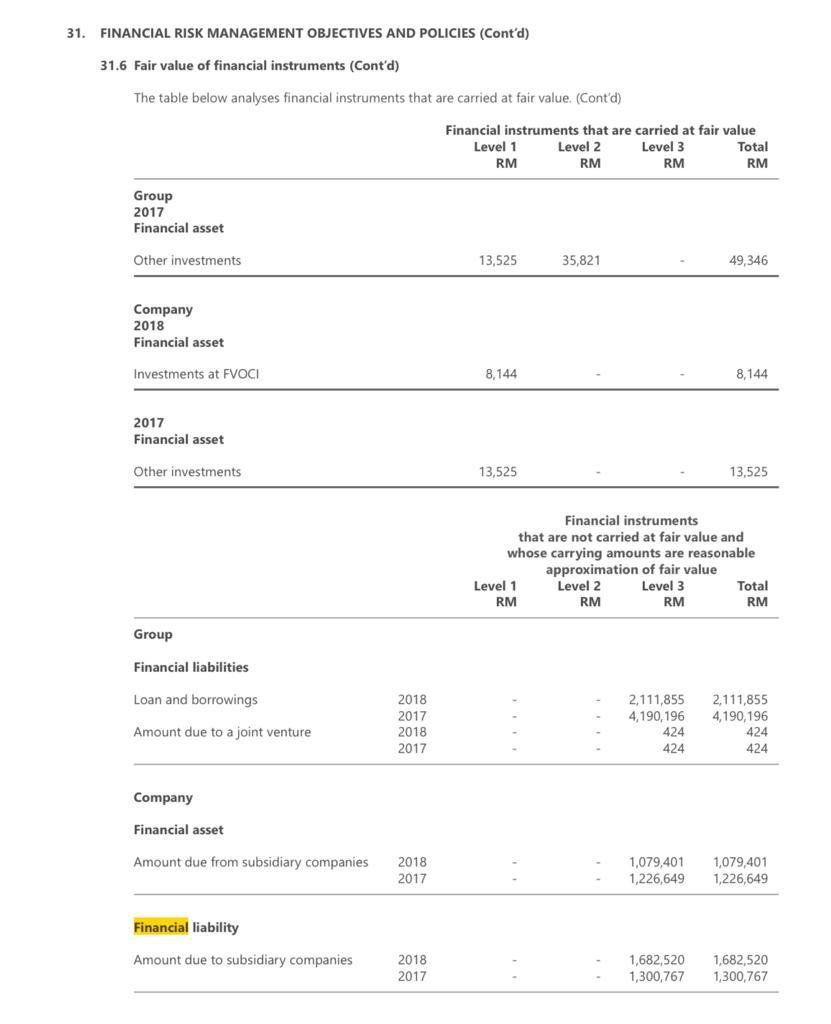
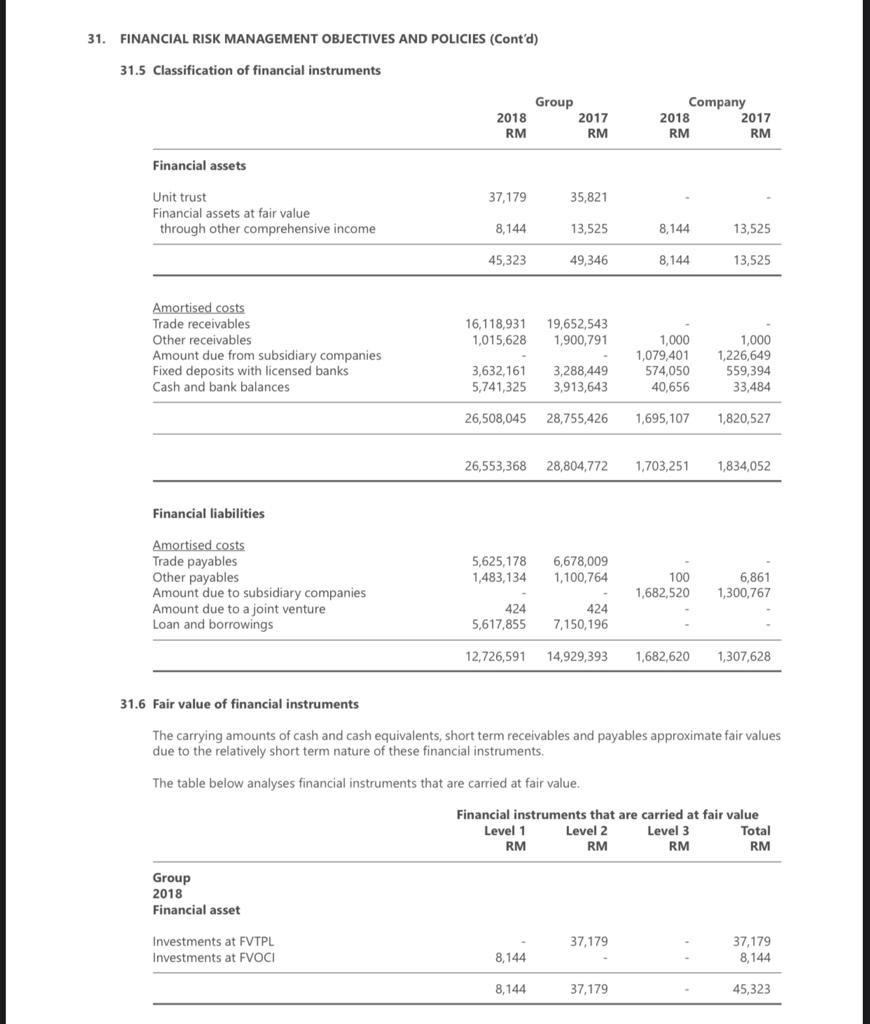
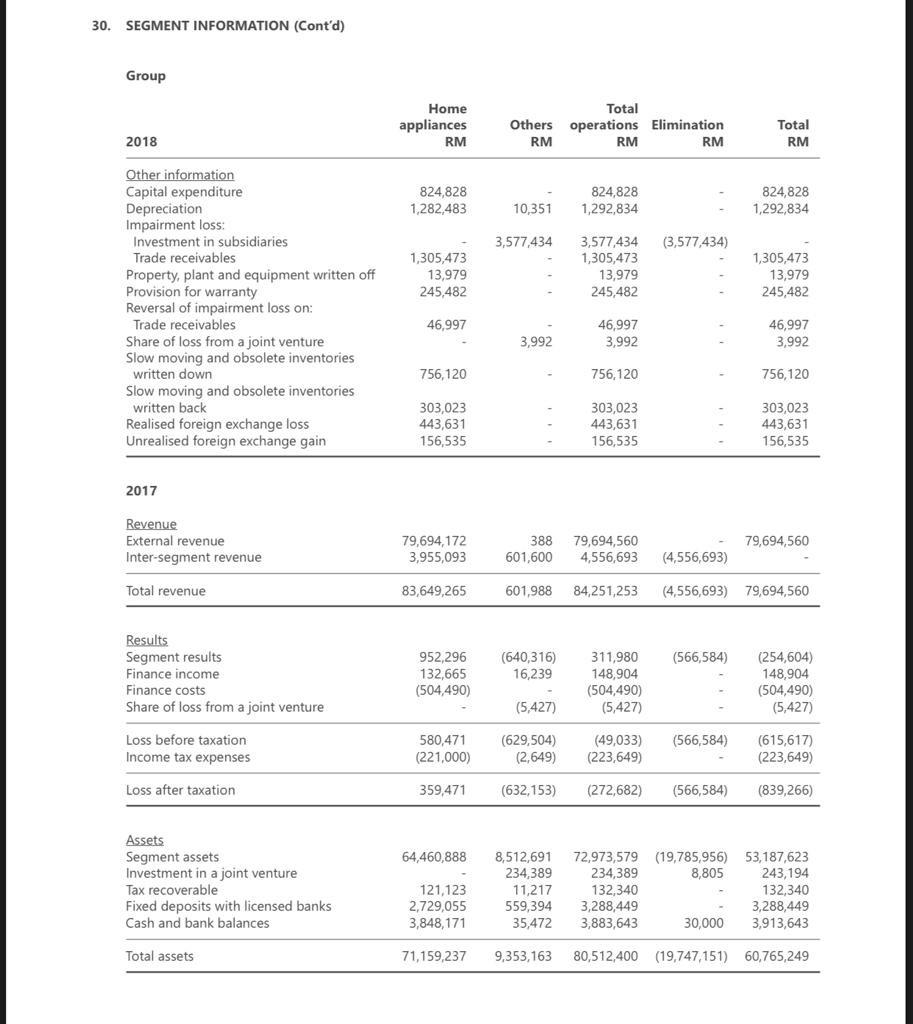
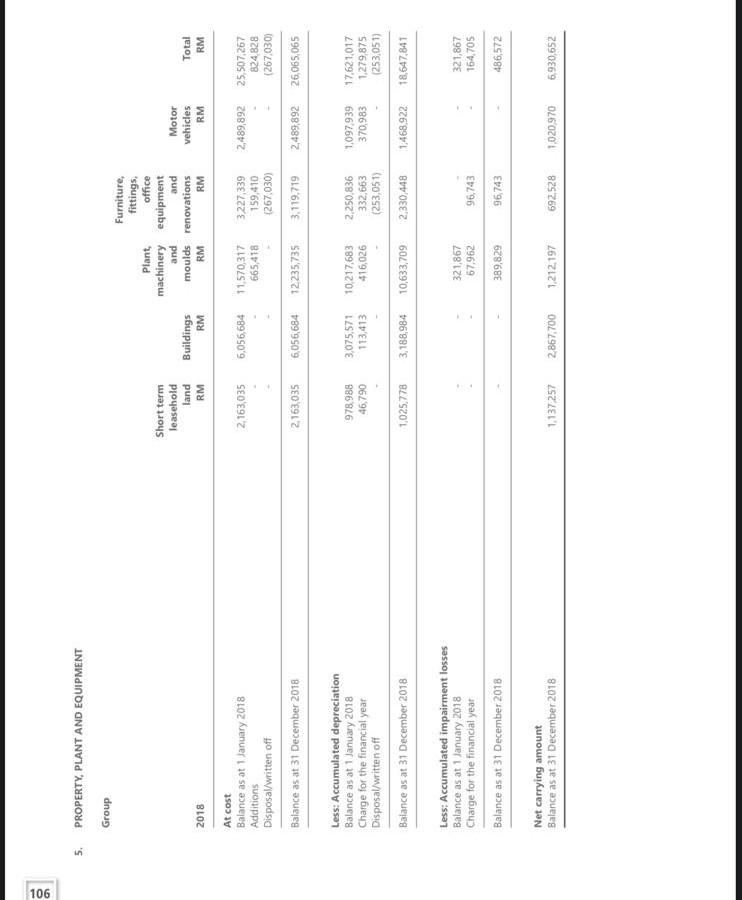
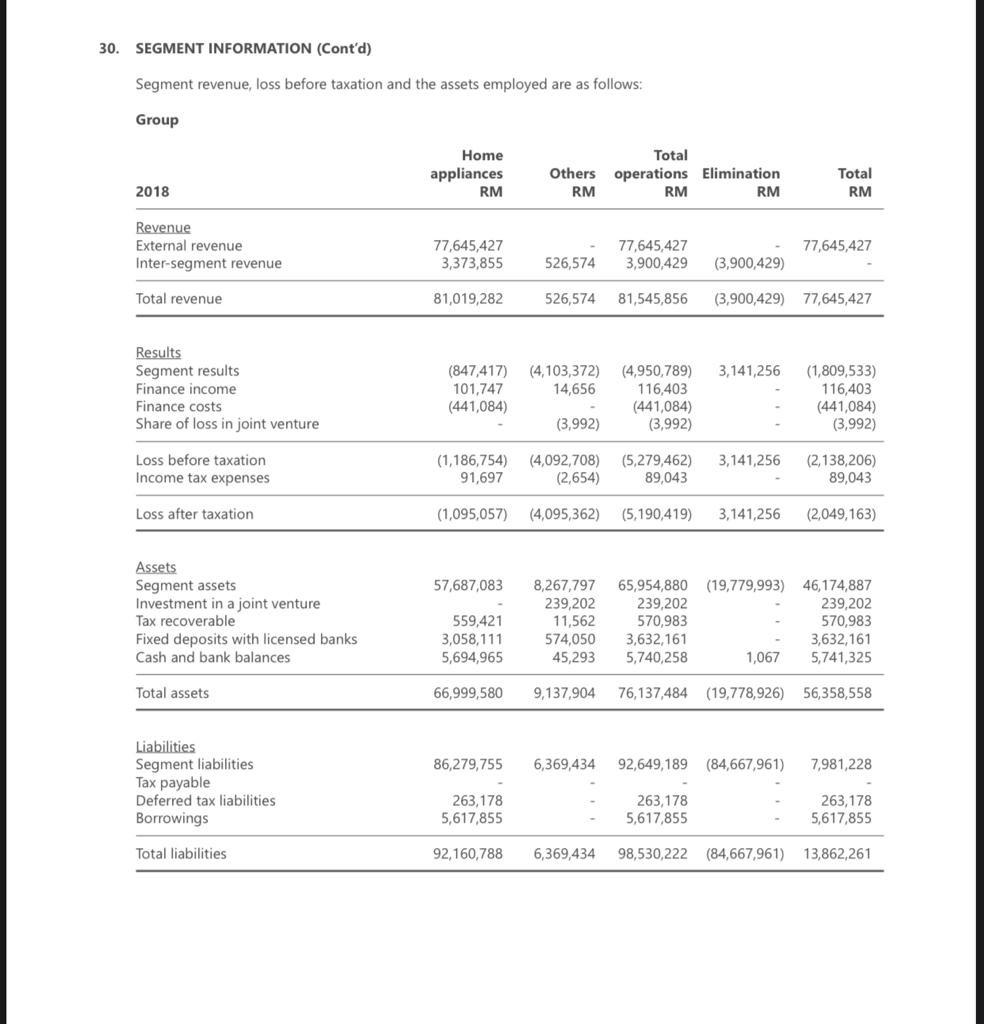
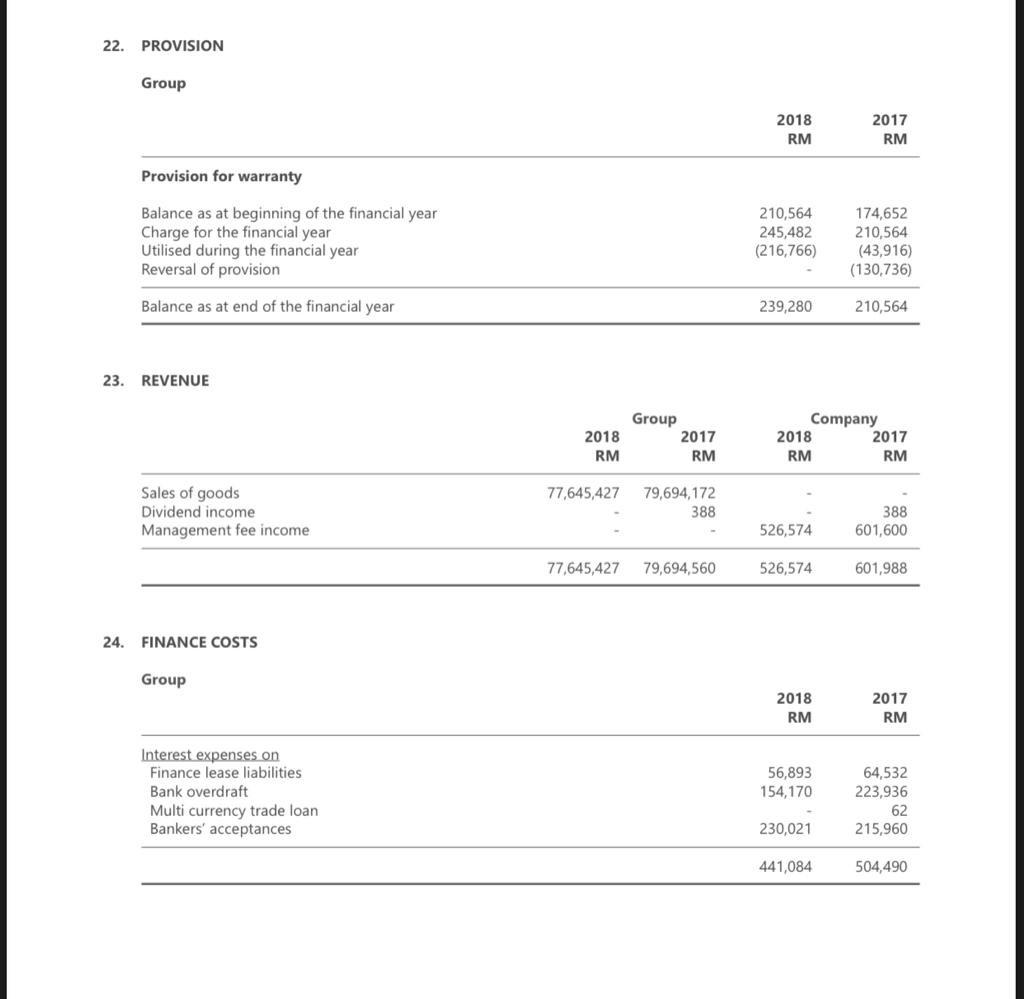
Group 2020 RM1000 2019 RM'000 Company 2020 RM'000 2019 RM'000 Note 11 12 13 2,883,143 248,036 3,031,878 2,852.110 305,986 2.595,088 15 773,361 772.751 Non-current assets Property, plant and equipment Intangible assets Right of use assets Investments in subsidiaries Other investment Trade and other receivables Contract costs Contract assets Derivative financial assets 16 18 14 78 344,538 57,887 28,886 61,728 6,656,174 78 427,565 66,170 26,661 18,605 6.292,263 5 19 773,361 772.751 17 18 Current assets Inventories Trade and other receivables Contract assets Income tax recoverable Cash and short-term deposits 5 137,207 972,387 66,437 51,676 302,853 1,530,560 8,186,734 90,501 1,220,923 79,590 8,448 457.716 1,857,178 8,149,441 20 250 828 254 773,615 832 773,583 Total assets Non-current liabilities Loans and borrowings Deferred tax liabilities Other liabilities 21 22 4.677,523 268,927 120,255 5,066,705 4.461,043 217,628 53,295 4.731,966 23 24 729 1,380 5 Current liabilities Trade and other payables Contract liabilities Derivative financial liabilities Other liabilities Loans and borrowings Income tax payable 1,432,986 306,283 394 19 23 21 1,784,308 283,572 419 420 688,756 13 2.757,488 7,489,454 774,510 5 734 2,514,173 7,580,878 13 1,393 1,393 734 Total liabilities Equity Share capital (Accumulated losses)/retained earnings Total equity Total equity and liabilities 25 27 769.655 (163,799) 605,856 8,186,734 769,655 (109.668) 659.987 8.149.441 769,655 3,226 772,881 773,615 769,655 2.535 772,190 773,583 Group 2020 RM1000 Company 2020 RM'000 2019 RM'000 Note 2019 RM'000 1,622,046 1,892,321 1.275.815 1,445,949 12 67,689 72,425 11 13 678,447 475,667 693,643 431,231 31.2 14 81,588 87,199 212 77.660 103,020 3,104 (1.275,000) (1,446,000) 6 212,547 231,076 2,604 (72) 50,708 120 (29,919) 15 (57) 625 53 (25,694) (102) (202) 23.1 (161) (4.953) (907) (1.235) Cash flows from operating activities Profit before tax Adjustments for Amortisation of intangible assets Depreciation - property, plant and equipment - right of use assets Allowance for expected credit loss on trade receivables and contract assets Amortisation of contract cost Inventories written down Dividend income Finance costs Loss on disposal of property, plant and equipment Gain on termination of lease Write-off of property, plant and equipment Write-off of intangible assets Interest income Reversal of provision for employee leave entitlements Waiver of debt Employee benefits - share-based payment - defined benefit plan Fair value (gain/loss on foreign currency forward contracts Unrealised foreign exchange gain Operating cash flows before changes in working capital Changes in working capital: Inventories Trade and other receivables Contract asset Contract costs Trade and other payables Contract liabilities Cash flows from operations Advance payment for bandwidth Interest paid Proceeds from government grants Payments for provisions Taxes paid Net cash flows from operating activities 1,871 93 367 70 26 (25) (259) 118 (1.722) 3,250,355 3.473,302 (194) (1,488) 256 1,544 (46,918) 126,184 8,786 (78,916) (353,193) 22.711 2,929,009 (10,872) (246,989) 154,263 (334) (393,019) 2,432,058 (32,470) (358,565) 71,764 (98,060) (373.903) (31,814) 2,650,254 (57.881) (234,311) 278,572 (93) (574,899) 2,061,642 62 56 23.1 (56) (32) 30 Profit before tax is derived after deducting/(crediting): (contd.) Company 2020 RM'000 Note 2019 RM'000 Group 2020 RM'000 165,974 212 2,883 22,579 (2,083) (259) 2019 RM1000 140,439 3,104 43,504 21,373 (843) (1.722) (25) 118 - Transmission facilities services Inventories written down Rental of land and buildings Rental of equipment and others Realised foreign exchange gain Unrealised foreign exchange gain Fair value (gain)/oss on foreign currency forward contracts Loss on disposal of property, plant and equipment Gain on termination of lease Write-off of property, plant and equipment Write-off of intangible asset Bad debts recovered Waiver of debt Interest income from deposits with licensed banks Unwinding of significant financing component of revenue contracts with deferred payment scheme 2,604 (72) 50,708 15 (57) 625 53 (15,708) 120 (16,149) (907) (1.235) (11,291) (18,320) (102) (202) (18,628) (7.374) 31. FINANCIAL RISK MANAGEMENT OBJECTIVES AND POLICIES (Cont'd) 31.4 Liquidity and cash flow risk (Cont'd) The following table sets out the maturity profile of the Group's and the Company's financial liabilities as at the end of the reporting period based on undiscounted contractual cash flows. Group Carrying amount RM Later than Contractual 1 year but interest Contractual Not later not later rate cash flow than 1 year than 5 years RM RM RM More than 5 years 2018 RM 7,741,524 7,741,524 Trade and other payables 7,741,524 Amount due to a joint venture 424 Bank overdraft 1,134,437 Finance lease liabilities 977,418 Bankers' accceptances 3,506,000 6.90 - 7.07 3.96 - 7.06 6.90 -7.07 424 1,134,437 1,049,559 3,506,000 424 1,134,437 365,964 3,506,000 683,595 13,359,803 13,431,944 12,748,349 683,595 2017 8,617,476 8,617,476 ade and other payables 8,617,476 Amount due to a joint venture 424 Bank overdraft 2,681,257 Finance lease liabilities 1,306,547 Bankers' accceptances 2,960,000 Multi currency trade loan 202,392 424 2,681,257 1,435,581 2,960,000 202,392 6.38 - 6.49 3.96 - 7.06 6.38 - 6.49 3.64 424 2,681,257 386,022 2,960,000 202,392 1,049,559 15,768,096 15,897,130 14,847,571 1,049,559 Company Carrying amount RM Later than Contractual 1 year but rate Contractual Not later not later interest cash flow than 1 year than 5 years RM RM RM More than 5 years RM 2018 202,239 202,239 202,239 Other payables Amount due to subsidiary companies 1,682,520 1,682,520 1,682,520 1,884,759 1,884,759 1,884,759 2017 220,495 220,495 220,495 Other payables Amount due to subsidiary companies 1,300,767 1,300,767 1,300,767 1,521,262 1,521,262 1,521,262 31. FINANCIAL RISK MANAGEMENT OBJECTIVES AND POLICIES (Cont'd) 31.6 Fair value of financial instruments (Cont'd) The table below analyses financial instruments that are carried at fair value. (Cont'd) Financial instruments that are carried at fair value Level 1 Level 2 Level 3 Total RM RM RM RM Group 2017 Financial asset Other investments 13,525 35,821 49,346 Company 2018 Financial asset Investments at FVOCI 8,144 8,144 2017 Financial asset Other investments 13,525 13.525 Financial instruments that are not carried at fair value and whose carrying amounts are reasonable approximation of fair value Level 1 Level 2 Level 3 Total RM RM RM RM Group Financial liabilities Loan and borrowings 2018 2017 2018 2,111,855 4,190, 196 424 424 2.111,855 4,190,196 424 424 Amount due to a joint venture 2017 Company Financial asset Amount due from subsidiary companies 2018 2017 1,079,401 1,226,649 1,079,401 1,226,649 Financial liability Amount due to subsidiary companies 2018 2017 1,682,520 1,300,767 1,682,520 1,300,767 31. FINANCIAL RISK MANAGEMENT OBJECTIVES AND POLICIES (Cont'd) 31.5 Classification of financial instruments 2018 RM Group 2017 RM Company 2018 2017 RM RM Financial assets 37,179 35,821 Unit trust Financial assets at fair value through other comprehensive income 8,144 13,525 8,144 13,525 45,323 49.346 8,144 13,525 Amortised costs Trade receivables Other receivables Amount due from subsidiary companies Fixed deposits with licensed banks Cash and bank balances 16,118,931 19,652,543 1,015,628 1,900,791 3,632,161 5,741,325 3,288,449 3,913,643 1,000 1,079,401 574,050 40,656 1,000 1,226,649 559,394 33,484 26,508,045 28,755,426 1,695,107 1,820,527 26,553,368 28,804,772 1,703,251 1,834,052 Financial liabilities Amortised costs Trade payables Other payables Amount due to subsidiary companies Amount due to a joint venture Loan and borrowings 5,625,178 1,483,134 6,678,009 1,100,764 100 1,682,520 6,861 1,300,767 424 5,617,855 424 7,150,196 12,726,591 14,929,393 1,682,620 1,307,628 31.6 Fair value of financial instruments The carrying amounts of cash and cash equivalents, short term receivables and payables approximate fair values due to the relatively short term nature of these financial instruments The table below analyses financial instruments that are carried at fair value. Financial instruments that are carried at fair value Level 1 Level 2 Level 3 Total RM RM RM RM Group 2018 Financial asset 37,179 Investments at FVTPL Investments at FVOCI 37,179 8,144 8,144 8,144 37,179 45,323 30. SEGMENT INFORMATION (Cont'd) Group Home appliances RM Others RM Total operations Elimination RM RM Total RM 2018 824,828 1,282,483 10,351 824,828 1,292,834 824,828 1,292,834 3,577,434 (3,577,434) 1,305,473 13,979 245,482 3,577,434 1,305,473 13,979 245,482 1,305,473 13,979 245,482 Other information Capital expenditure Depreciation Impairment loss Investment in subsidiaries Trade receivables be Property, plant and equipment written off Provision for warranty Reversal of impairment loss on: Trade receivables Share of loss from a joint venture Slow moving and obsolete inventories written down Slow moving and obsolete inventories written back Realised foreign exchange loss Unrealised foreign exchange gain 46,997 46,997 3.992 46,997 3,992 3,992 756,120 756,120 756,120 303,023 443,631 156,535 303,023 443,631 156,535 303,023 443,631 156,535 2017 Revenue External revenue Inter-segment revenue 79,694,172 3,955,093 388 601,600 79,694,560 79,694,560 4,556,693 (4,556,693) Total revenue 83,649,265 601,988 84,251,253 (4,556,693) 79,694,560 Results Segment results Finance income Finance costs Share of loss from a joint venture (566,584) 952,296 132,665 (504,490) (640,316) 16.239 311,980 148,904 (504,490) (5,427) (254,604) 148,904 (504,490) (5,427) (5,427) Loss before taxation Income tax expenses 580,471 (221,000) (629,504) (2,649) (49,033) (223,649) (566,584) (615,617) (223,649) Loss after taxation 359,471 (632,153) (272,682) (566,584) (839,266) 64,460,888 Assets Segment assets Investment in a joint venture Tax recoverable Fixed deposits with licensed banks Cash and bank balances 8,512,691 234,389 11,217 559,394 35,472 121,123 2,729,055 3,848,171 72,973,579 (19,785,956) 53,187,623 234,389 8,805 243,194 132,340 3,288,449 3,288,449 3,883,643 30,000 3,913,643 132,340 Total assets 71,159,237 9,353,163 80,512,400 (19,747,151) 60,765,249 106 5. PROPERTY, PLANT AND EQUIPMENT Group Short term leasehold Furniture fittings, Plant office machinery equipment and and moulds renovations RM RM land RM 2018 Motor vehicles RM Buildings RM Total RM 2,163,035 6,056,684 11.570,317 665,418 2,489,892 At cost Balance as at 1 January 2018 Additions Disposa/written oft Balance as at 31 December 2018 3227,339 159,410 (267,030) 25,507,267 824828 (267.030) 2, 163,035 6,056,684 12235735 3,119,719 2,489,892 26,065,065 978988 46,790 3,075,571 113,413 10,217,683 416,026 Less: Accumulated depreciation Balance as at 1 January 2018 Charge for the financial year Disposal written off Balance as at 31 December 2018 2,250,836 332,663 (253,051) 1,097 939 370,983 17,621,017 1,279,875 (253,051) 1,025,778 3.188.984 10,633,709 2,330,448 1,468,922 18,647,841 Less: Accumulated impairment losses Balance as at 1 January 2018 Charge for the financial year Balance as at 31 December 2018 321,867 67,962 321,867 164 705 96,743 389,829 96743 486,572 Net carrying amount Balance as at 31 December 2018 1.137.257 2,867,700 1,212,197 692528 1,020,970 6.930,652 30. SEGMENT INFORMATION (Cont'd) Segment revenue, loss before taxation and the assets employed are as follows: Group Home appliances RM Total Others operations Elimination RM RM RM Total RM 2018 Revenue External revenue Inter-segment revenue 77,645,427 3,373,855 77,645,427 3,900,429 77,645,427 526,574 (3,900,429) Total revenue 81,019,282 526,574 81,545,856 (3,900,429) 77,645,427 Results Segment results Finance income Finance costs Share of loss in joint venture 3,141,256 (847,417) 101,747 (441,084) (4,103,372) 14,656 (4,950,789) 116,403 (441,084) (3,992) (1,809,533) 116,403 (441,084) (3,992) (3,992) Loss before taxation Income tax expenses (1,186,754) 91,697 (4,092,708) (2,654) (5,279,462) 89,043 3,141,256 (2,138,206) 89,043 Loss after taxation (1,095,057) (4,095,362) (5,190,419) 3,141,256 (2,049,163) 57,687,083 (19,779,993) Assets Segment assets Investment in a joint venture Tax recoverable Fixed deposits with licensed banks Cash and bank balances 559,421 3,058,111 5,694,965 8,267,797 239,202 11,562 574,050 45,293 65,954,880 239,202 570,983 3,632,161 5,740,258 46,174,887 239,202 570,983 3,632,161 5,741,325 1,067 Total assets 66,999,580 9,137,904 76,137,484 (19,778,926) 56,358,558 86,279,755 6,369,434 92,649,189 (84,667,961) 7,981,228 Liabilities Segment liabilities Tax payable Deferred tax liabilities Borrowings 263,178 5,617,855 263,178 5,617,855 263,178 5,617,855 Total liabilities 92,160,788 6,369,434 98,530,222 (84,667,961) 13,862,261 22. PROVISION Group 2018 RM 2017 RM Provision for warranty Balance as at beginning of the financial year Charge for the financial year Utilised during the financial year Reversal of provision 210,564 245,482 (216,766) 174,652 210,564 (43,916) (130,736) Balance as at end of the financial year 239,280 210,564 23. REVENUE Group 2018 RM 2017 RM Company 2018 2017 RM RM 77,645,427 Sales of goods Dividend income Management fee income 79,694,172 388 388 601,600 526,574 77,645,427 79,694,560 526,574 601,988 24. FINANCE COSTS Group 2018 RM 2017 RM Interest expenses on Finance lease liabilities Bank overdraft Multi currency trade loan Bankers' acceptances 56,893 154,170 64,532 223,936 62 215,960 230,021 441,084 504,490 Group 2020 RM1000 2019 RM'000 Company 2020 RM'000 2019 RM'000 Note 11 12 13 2,883,143 248,036 3,031,878 2,852.110 305,986 2.595,088 15 773,361 772.751 Non-current assets Property, plant and equipment Intangible assets Right of use assets Investments in subsidiaries Other investment Trade and other receivables Contract costs Contract assets Derivative financial assets 16 18 14 78 344,538 57,887 28,886 61,728 6,656,174 78 427,565 66,170 26,661 18,605 6.292,263 5 19 773,361 772.751 17 18 Current assets Inventories Trade and other receivables Contract assets Income tax recoverable Cash and short-term deposits 5 137,207 972,387 66,437 51,676 302,853 1,530,560 8,186,734 90,501 1,220,923 79,590 8,448 457.716 1,857,178 8,149,441 20 250 828 254 773,615 832 773,583 Total assets Non-current liabilities Loans and borrowings Deferred tax liabilities Other liabilities 21 22 4.677,523 268,927 120,255 5,066,705 4.461,043 217,628 53,295 4.731,966 23 24 729 1,380 5 Current liabilities Trade and other payables Contract liabilities Derivative financial liabilities Other liabilities Loans and borrowings Income tax payable 1,432,986 306,283 394 19 23 21 1,784,308 283,572 419 420 688,756 13 2.757,488 7,489,454 774,510 5 734 2,514,173 7,580,878 13 1,393 1,393 734 Total liabilities Equity Share capital (Accumulated losses)/retained earnings Total equity Total equity and liabilities 25 27 769.655 (163,799) 605,856 8,186,734 769,655 (109.668) 659.987 8.149.441 769,655 3,226 772,881 773,615 769,655 2.535 772,190 773,583 Group 2020 RM1000 Company 2020 RM'000 2019 RM'000 Note 2019 RM'000 1,622,046 1,892,321 1.275.815 1,445,949 12 67,689 72,425 11 13 678,447 475,667 693,643 431,231 31.2 14 81,588 87,199 212 77.660 103,020 3,104 (1.275,000) (1,446,000) 6 212,547 231,076 2,604 (72) 50,708 120 (29,919) 15 (57) 625 53 (25,694) (102) (202) 23.1 (161) (4.953) (907) (1.235) Cash flows from operating activities Profit before tax Adjustments for Amortisation of intangible assets Depreciation - property, plant and equipment - right of use assets Allowance for expected credit loss on trade receivables and contract assets Amortisation of contract cost Inventories written down Dividend income Finance costs Loss on disposal of property, plant and equipment Gain on termination of lease Write-off of property, plant and equipment Write-off of intangible assets Interest income Reversal of provision for employee leave entitlements Waiver of debt Employee benefits - share-based payment - defined benefit plan Fair value (gain/loss on foreign currency forward contracts Unrealised foreign exchange gain Operating cash flows before changes in working capital Changes in working capital: Inventories Trade and other receivables Contract asset Contract costs Trade and other payables Contract liabilities Cash flows from operations Advance payment for bandwidth Interest paid Proceeds from government grants Payments for provisions Taxes paid Net cash flows from operating activities 1,871 93 367 70 26 (25) (259) 118 (1.722) 3,250,355 3.473,302 (194) (1,488) 256 1,544 (46,918) 126,184 8,786 (78,916) (353,193) 22.711 2,929,009 (10,872) (246,989) 154,263 (334) (393,019) 2,432,058 (32,470) (358,565) 71,764 (98,060) (373.903) (31,814) 2,650,254 (57.881) (234,311) 278,572 (93) (574,899) 2,061,642 62 56 23.1 (56) (32) 30 Profit before tax is derived after deducting/(crediting): (contd.) Company 2020 RM'000 Note 2019 RM'000 Group 2020 RM'000 165,974 212 2,883 22,579 (2,083) (259) 2019 RM1000 140,439 3,104 43,504 21,373 (843) (1.722) (25) 118 - Transmission facilities services Inventories written down Rental of land and buildings Rental of equipment and others Realised foreign exchange gain Unrealised foreign exchange gain Fair value (gain)/oss on foreign currency forward contracts Loss on disposal of property, plant and equipment Gain on termination of lease Write-off of property, plant and equipment Write-off of intangible asset Bad debts recovered Waiver of debt Interest income from deposits with licensed banks Unwinding of significant financing component of revenue contracts with deferred payment scheme 2,604 (72) 50,708 15 (57) 625 53 (15,708) 120 (16,149) (907) (1.235) (11,291) (18,320) (102) (202) (18,628) (7.374) 31. FINANCIAL RISK MANAGEMENT OBJECTIVES AND POLICIES (Cont'd) 31.4 Liquidity and cash flow risk (Cont'd) The following table sets out the maturity profile of the Group's and the Company's financial liabilities as at the end of the reporting period based on undiscounted contractual cash flows. Group Carrying amount RM Later than Contractual 1 year but interest Contractual Not later not later rate cash flow than 1 year than 5 years RM RM RM More than 5 years 2018 RM 7,741,524 7,741,524 Trade and other payables 7,741,524 Amount due to a joint venture 424 Bank overdraft 1,134,437 Finance lease liabilities 977,418 Bankers' accceptances 3,506,000 6.90 - 7.07 3.96 - 7.06 6.90 -7.07 424 1,134,437 1,049,559 3,506,000 424 1,134,437 365,964 3,506,000 683,595 13,359,803 13,431,944 12,748,349 683,595 2017 8,617,476 8,617,476 ade and other payables 8,617,476 Amount due to a joint venture 424 Bank overdraft 2,681,257 Finance lease liabilities 1,306,547 Bankers' accceptances 2,960,000 Multi currency trade loan 202,392 424 2,681,257 1,435,581 2,960,000 202,392 6.38 - 6.49 3.96 - 7.06 6.38 - 6.49 3.64 424 2,681,257 386,022 2,960,000 202,392 1,049,559 15,768,096 15,897,130 14,847,571 1,049,559 Company Carrying amount RM Later than Contractual 1 year but rate Contractual Not later not later interest cash flow than 1 year than 5 years RM RM RM More than 5 years RM 2018 202,239 202,239 202,239 Other payables Amount due to subsidiary companies 1,682,520 1,682,520 1,682,520 1,884,759 1,884,759 1,884,759 2017 220,495 220,495 220,495 Other payables Amount due to subsidiary companies 1,300,767 1,300,767 1,300,767 1,521,262 1,521,262 1,521,262 31. FINANCIAL RISK MANAGEMENT OBJECTIVES AND POLICIES (Cont'd) 31.6 Fair value of financial instruments (Cont'd) The table below analyses financial instruments that are carried at fair value. (Cont'd) Financial instruments that are carried at fair value Level 1 Level 2 Level 3 Total RM RM RM RM Group 2017 Financial asset Other investments 13,525 35,821 49,346 Company 2018 Financial asset Investments at FVOCI 8,144 8,144 2017 Financial asset Other investments 13,525 13.525 Financial instruments that are not carried at fair value and whose carrying amounts are reasonable approximation of fair value Level 1 Level 2 Level 3 Total RM RM RM RM Group Financial liabilities Loan and borrowings 2018 2017 2018 2,111,855 4,190, 196 424 424 2.111,855 4,190,196 424 424 Amount due to a joint venture 2017 Company Financial asset Amount due from subsidiary companies 2018 2017 1,079,401 1,226,649 1,079,401 1,226,649 Financial liability Amount due to subsidiary companies 2018 2017 1,682,520 1,300,767 1,682,520 1,300,767 31. FINANCIAL RISK MANAGEMENT OBJECTIVES AND POLICIES (Cont'd) 31.5 Classification of financial instruments 2018 RM Group 2017 RM Company 2018 2017 RM RM Financial assets 37,179 35,821 Unit trust Financial assets at fair value through other comprehensive income 8,144 13,525 8,144 13,525 45,323 49.346 8,144 13,525 Amortised costs Trade receivables Other receivables Amount due from subsidiary companies Fixed deposits with licensed banks Cash and bank balances 16,118,931 19,652,543 1,015,628 1,900,791 3,632,161 5,741,325 3,288,449 3,913,643 1,000 1,079,401 574,050 40,656 1,000 1,226,649 559,394 33,484 26,508,045 28,755,426 1,695,107 1,820,527 26,553,368 28,804,772 1,703,251 1,834,052 Financial liabilities Amortised costs Trade payables Other payables Amount due to subsidiary companies Amount due to a joint venture Loan and borrowings 5,625,178 1,483,134 6,678,009 1,100,764 100 1,682,520 6,861 1,300,767 424 5,617,855 424 7,150,196 12,726,591 14,929,393 1,682,620 1,307,628 31.6 Fair value of financial instruments The carrying amounts of cash and cash equivalents, short term receivables and payables approximate fair values due to the relatively short term nature of these financial instruments The table below analyses financial instruments that are carried at fair value. Financial instruments that are carried at fair value Level 1 Level 2 Level 3 Total RM RM RM RM Group 2018 Financial asset 37,179 Investments at FVTPL Investments at FVOCI 37,179 8,144 8,144 8,144 37,179 45,323 30. SEGMENT INFORMATION (Cont'd) Group Home appliances RM Others RM Total operations Elimination RM RM Total RM 2018 824,828 1,282,483 10,351 824,828 1,292,834 824,828 1,292,834 3,577,434 (3,577,434) 1,305,473 13,979 245,482 3,577,434 1,305,473 13,979 245,482 1,305,473 13,979 245,482 Other information Capital expenditure Depreciation Impairment loss Investment in subsidiaries Trade receivables be Property, plant and equipment written off Provision for warranty Reversal of impairment loss on: Trade receivables Share of loss from a joint venture Slow moving and obsolete inventories written down Slow moving and obsolete inventories written back Realised foreign exchange loss Unrealised foreign exchange gain 46,997 46,997 3.992 46,997 3,992 3,992 756,120 756,120 756,120 303,023 443,631 156,535 303,023 443,631 156,535 303,023 443,631 156,535 2017 Revenue External revenue Inter-segment revenue 79,694,172 3,955,093 388 601,600 79,694,560 79,694,560 4,556,693 (4,556,693) Total revenue 83,649,265 601,988 84,251,253 (4,556,693) 79,694,560 Results Segment results Finance income Finance costs Share of loss from a joint venture (566,584) 952,296 132,665 (504,490) (640,316) 16.239 311,980 148,904 (504,490) (5,427) (254,604) 148,904 (504,490) (5,427) (5,427) Loss before taxation Income tax expenses 580,471 (221,000) (629,504) (2,649) (49,033) (223,649) (566,584) (615,617) (223,649) Loss after taxation 359,471 (632,153) (272,682) (566,584) (839,266) 64,460,888 Assets Segment assets Investment in a joint venture Tax recoverable Fixed deposits with licensed banks Cash and bank balances 8,512,691 234,389 11,217 559,394 35,472 121,123 2,729,055 3,848,171 72,973,579 (19,785,956) 53,187,623 234,389 8,805 243,194 132,340 3,288,449 3,288,449 3,883,643 30,000 3,913,643 132,340 Total assets 71,159,237 9,353,163 80,512,400 (19,747,151) 60,765,249 106 5. PROPERTY, PLANT AND EQUIPMENT Group Short term leasehold Furniture fittings, Plant office machinery equipment and and moulds renovations RM RM land RM 2018 Motor vehicles RM Buildings RM Total RM 2,163,035 6,056,684 11.570,317 665,418 2,489,892 At cost Balance as at 1 January 2018 Additions Disposa/written oft Balance as at 31 December 2018 3227,339 159,410 (267,030) 25,507,267 824828 (267.030) 2, 163,035 6,056,684 12235735 3,119,719 2,489,892 26,065,065 978988 46,790 3,075,571 113,413 10,217,683 416,026 Less: Accumulated depreciation Balance as at 1 January 2018 Charge for the financial year Disposal written off Balance as at 31 December 2018 2,250,836 332,663 (253,051) 1,097 939 370,983 17,621,017 1,279,875 (253,051) 1,025,778 3.188.984 10,633,709 2,330,448 1,468,922 18,647,841 Less: Accumulated impairment losses Balance as at 1 January 2018 Charge for the financial year Balance as at 31 December 2018 321,867 67,962 321,867 164 705 96,743 389,829 96743 486,572 Net carrying amount Balance as at 31 December 2018 1.137.257 2,867,700 1,212,197 692528 1,020,970 6.930,652 30. SEGMENT INFORMATION (Cont'd) Segment revenue, loss before taxation and the assets employed are as follows: Group Home appliances RM Total Others operations Elimination RM RM RM Total RM 2018 Revenue External revenue Inter-segment revenue 77,645,427 3,373,855 77,645,427 3,900,429 77,645,427 526,574 (3,900,429) Total revenue 81,019,282 526,574 81,545,856 (3,900,429) 77,645,427 Results Segment results Finance income Finance costs Share of loss in joint venture 3,141,256 (847,417) 101,747 (441,084) (4,103,372) 14,656 (4,950,789) 116,403 (441,084) (3,992) (1,809,533) 116,403 (441,084) (3,992) (3,992) Loss before taxation Income tax expenses (1,186,754) 91,697 (4,092,708) (2,654) (5,279,462) 89,043 3,141,256 (2,138,206) 89,043 Loss after taxation (1,095,057) (4,095,362) (5,190,419) 3,141,256 (2,049,163) 57,687,083 (19,779,993) Assets Segment assets Investment in a joint venture Tax recoverable Fixed deposits with licensed banks Cash and bank balances 559,421 3,058,111 5,694,965 8,267,797 239,202 11,562 574,050 45,293 65,954,880 239,202 570,983 3,632,161 5,740,258 46,174,887 239,202 570,983 3,632,161 5,741,325 1,067 Total assets 66,999,580 9,137,904 76,137,484 (19,778,926) 56,358,558 86,279,755 6,369,434 92,649,189 (84,667,961) 7,981,228 Liabilities Segment liabilities Tax payable Deferred tax liabilities Borrowings 263,178 5,617,855 263,178 5,617,855 263,178 5,617,855 Total liabilities 92,160,788 6,369,434 98,530,222 (84,667,961) 13,862,261 22. PROVISION Group 2018 RM 2017 RM Provision for warranty Balance as at beginning of the financial year Charge for the financial year Utilised during the financial year Reversal of provision 210,564 245,482 (216,766) 174,652 210,564 (43,916) (130,736) Balance as at end of the financial year 239,280 210,564 23. REVENUE Group 2018 RM 2017 RM Company 2018 2017 RM RM 77,645,427 Sales of goods Dividend income Management fee income 79,694,172 388 388 601,600 526,574 77,645,427 79,694,560 526,574 601,988 24. FINANCE COSTS Group 2018 RM 2017 RM Interest expenses on Finance lease liabilities Bank overdraft Multi currency trade loan Bankers' acceptances 56,893 154,170 64,532 223,936 62 215,960 230,021 441,084 504,490
Step by Step Solution
There are 3 Steps involved in it
Step: 1

Get Instant Access to Expert-Tailored Solutions
See step-by-step solutions with expert insights and AI powered tools for academic success
Step: 2

Step: 3

Ace Your Homework with AI
Get the answers you need in no time with our AI-driven, step-by-step assistance
Get Started


