Calculate the following for 2018 using the given formulae and vividly explain the ratio analysis, referring to the calculations of the company in 2018; interpret all the connections of good and bad in terms of the calculation to the company:
(1)Current ratio = Current assets /Current liabilities (2)Quick ratio=(Current assets - Inventory)/Current liabilities (3)Inventory turnover = Cost of goods sold / Inventory (4)Average Collection =Accounts Receivable /Average Sales Per Day {Period=Accounts Receivable /(Annual Sales/365)} (5)Total asset turnover = Sales / Total assets (6)Debt Ratio= Total Liabilities / Total Assets (7)Times interest earned ratio = Earnings before interest and taxes / Interest (8)Gross profit margin = (Sales - Cost of sales) / Sales (9)Operating profit margin = Operating profits / Sales (10)Net profit margin = Earnings available for common stockholders / Sales (11)Earnings per share = Earnings available for Common Stockholders / Number of shares of Common Stok Outstanding (12)ROA = Earnings available for common stockholders / Total assets (13)ROE= Earnings available for common stockholders / Common stock equity (14) P/E ratio = Market price per share of common stock / Earnings per share (15)Market/Book (M/B) ratio = Market price per share of common stock /(Common Stock Equity/Number of Common Stock Outstanding) (16)DuPont=Net Income/sales x Sales/assets x Assets/ total equity 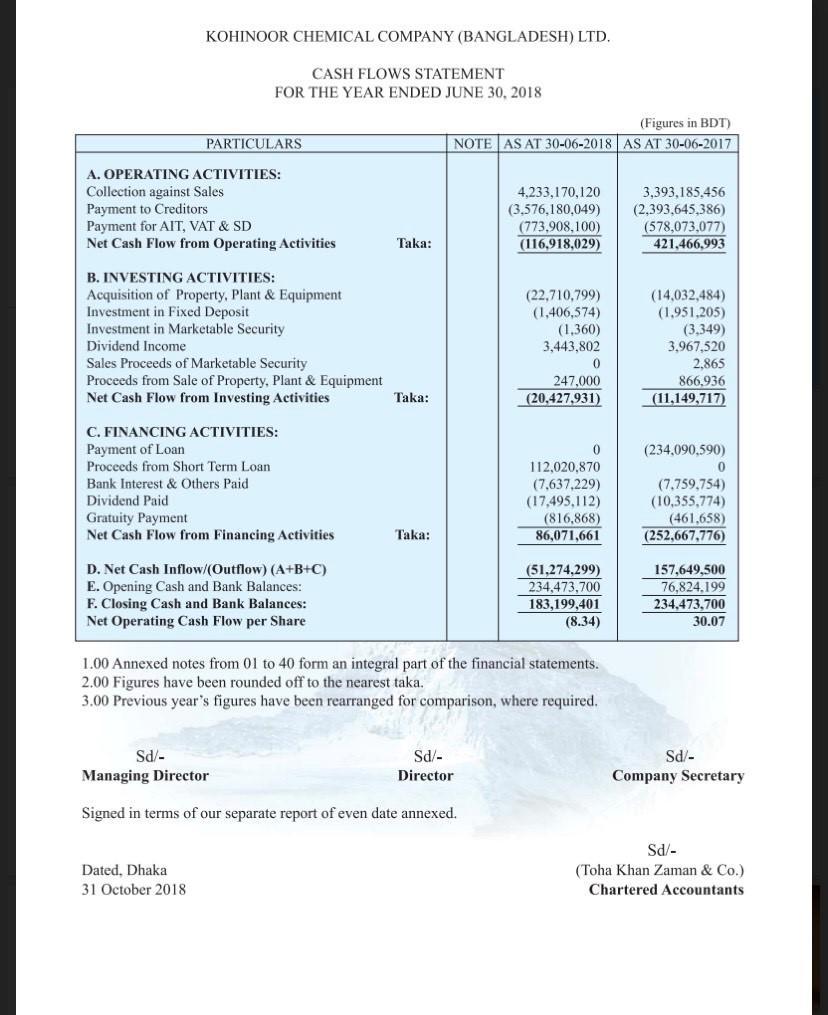
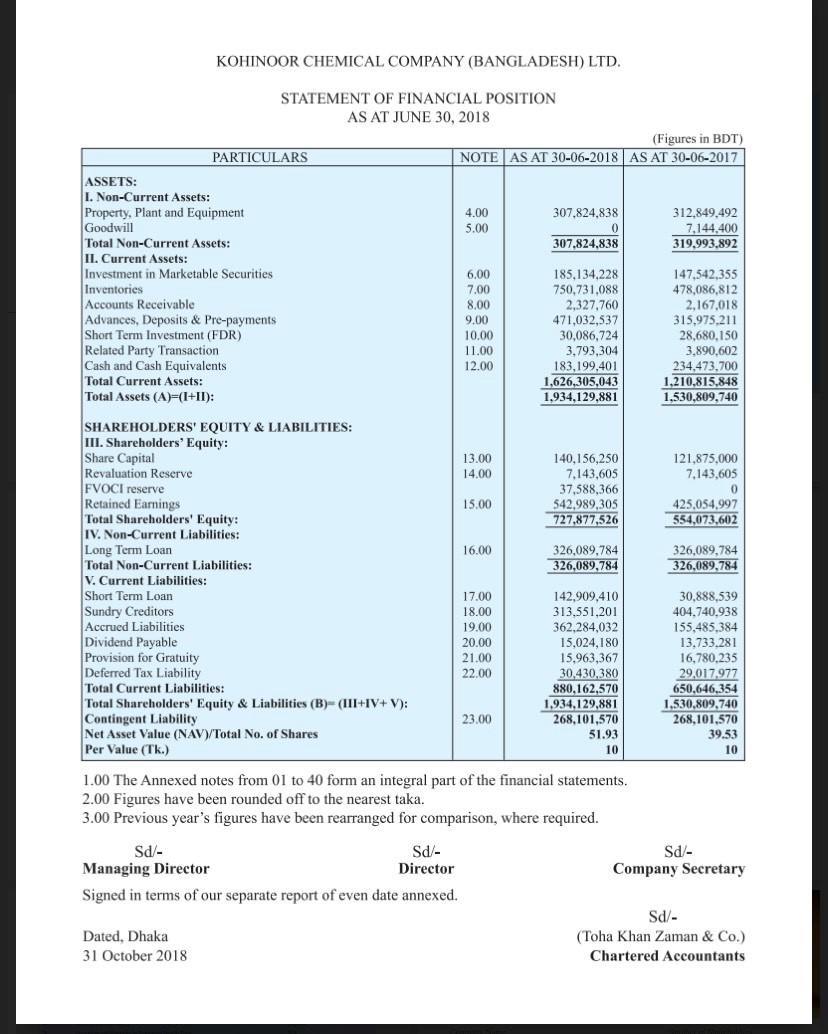
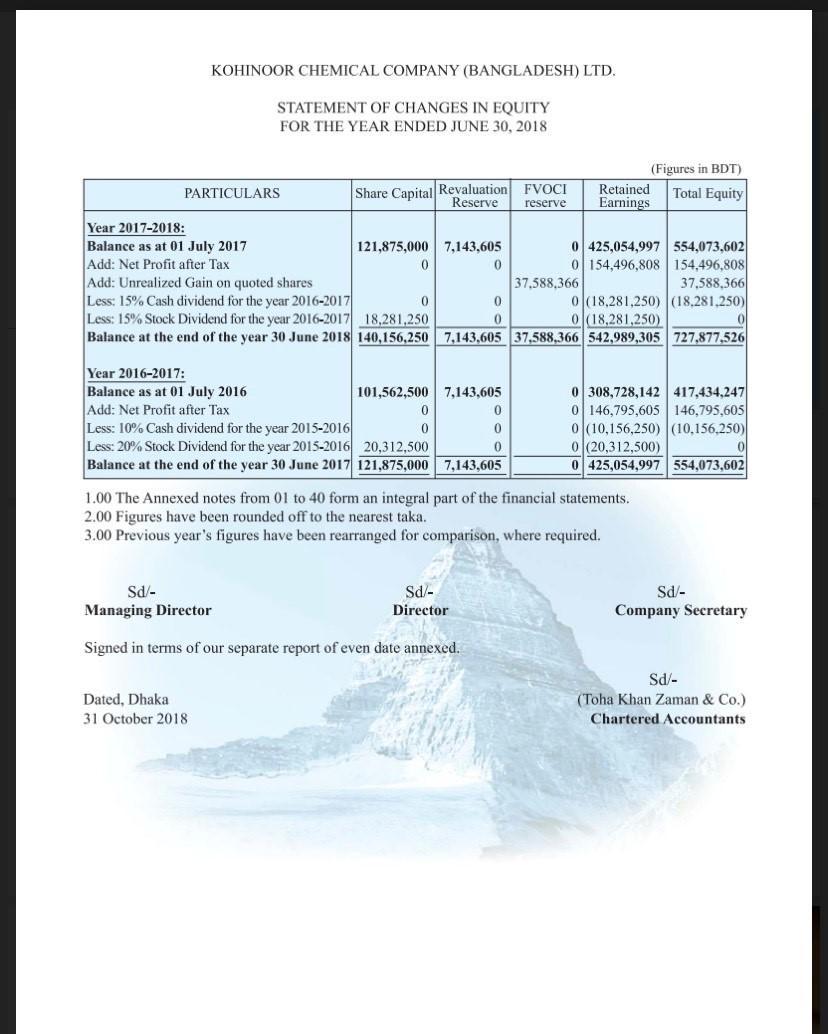
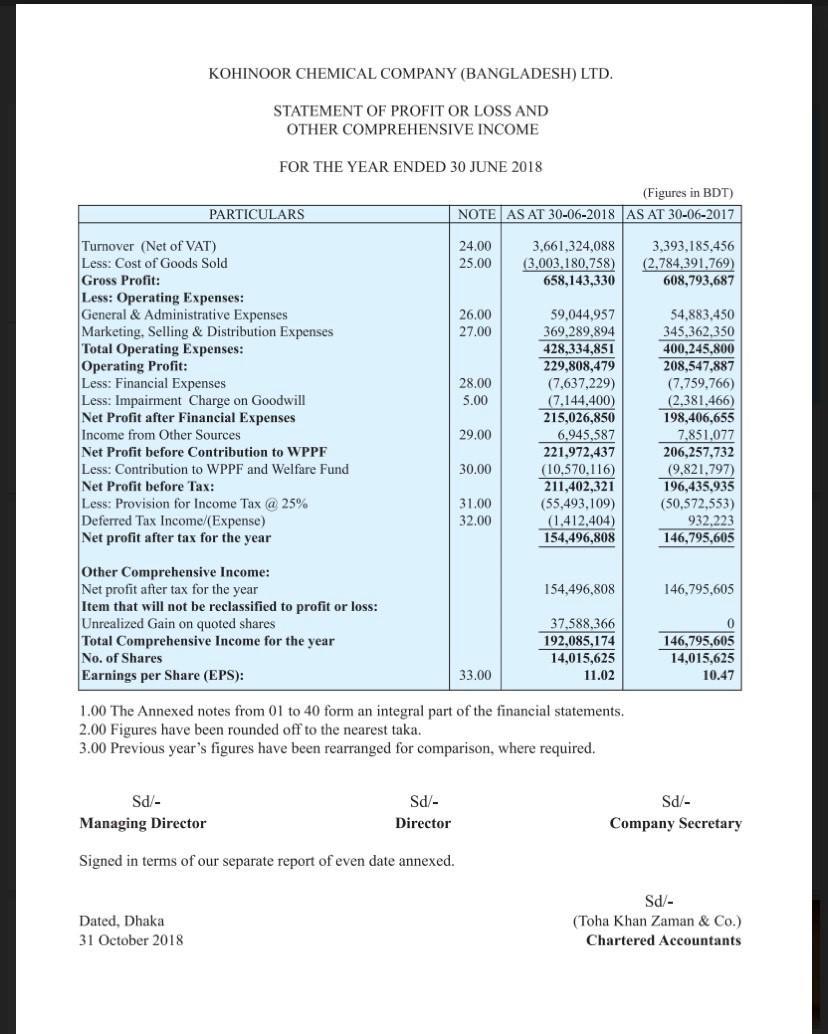
KOHINOOR CHEMICAL COMPANY (BANGLADESH) LTD. CASH FLOWS STATEMENT FOR THE YEAR ENDED JUNE 30, 2018 (Figures in BDT) AS AT 30-06-2018 AS AT 30-06-2017 PARTICULARS NOTE A. OPERATING ACTIVITIES: Collection against Sales Payment to Creditors Payment for AIT, VAT & SD Net Cash Flow from Operating Activities 4,233,170,120 (3,576,180,049) (773.908,100) (116,918,029) 3,393,185,456 (2,393,645,386) (578,073,077) 421,466.993 Taka: B. INVESTING ACTIVITIES: Acquisition of Property, Plant & Equipment Investment in Fixed Deposit Investment in Marketable Security Dividend Income Sales Proceeds of Marketable Security Proceeds from Sale of Property, Plant & Equipment Net Cash Flow from Investing Activities (22,710,799) (1,406,574) (1.360) 3,443,802 (14,032,484) (1.951,205) (3,349) 3,967,520 2.865 866,936 (11,149,717) Taka: 247,000 (20,427,931) C. FINANCING ACTIVITIES: Payment of Loan Proceeds from Short Term Loan Bank Interest & Others Paid Dividend Paid Gratuity Payment Net Cash Flow from Financing Activities 0 112,020,870 (7,637,229) (17,495,112) (816,868) 86,071,661 (234,090,590) 0 (7.759,754) (10,355,774) (461.658) (252,667,776) Taka: D. Net Cash Inflow/(Outflow) (A+B+C) E. Opening Cash and Bank Balances: F. Closing Cash and Bank Balances: Net Operating Cash Flow per Share (51,274,299) 234,473,700 183,199,401 (8.34) 157,649,500 76,824.199 234,473,700 30.07 1.00 Annexed notes from 01 to 40 form an integral part of the financial statements. 2.00 Figures have been rounded off to the nearest taka, 3.00 Previous year's figures have been rearranged for comparison, where required. Sd/- Managing Director Sd/- Director Sd/- Company Secretary Signed in terms of our separate report of even date annexed. Dated, Dhaka 31 October 2018 Sd/- (Toha Khan Zaman & Co.) Chartered Accountants KOHINOOR CHEMICAL COMPANY (BANGLADESH) LTD. STATEMENT OF FINANCIAL POSITION AS AT JUNE 30, 2018 (Figures in BDT) PARTICULARS NOTE AS AT 30-06-2018 AS AT 30-06-2017 ASSETS: Non-Current Assets: Property, Plant and Equipment 4.00 307,824,838 312.849,492 Goodwill 5.00 7,144.400 Total Non-Current Assets: 307.824.838 319,993,892 II. Current Assets: Investment in Marketable Securities 6.00 185,134,228 147,542,355 Inventories 7.00 750,731.088 478,086,812 Accounts Receivable 8,00 2,327.760 2,167,018 Advances, Deposits & Pre-payments 9.00 471,032,537 315,975,211 Short Term Investment (FDR) 10.00 30,086,724 28,680,150 Related Party Transaction 11.00 3.793,304 3,890.602 Cash and Cash Equivalents 12.00 183,199,401 234,473.700 Total Current Assets: 1,626,305,043 1,210.815.848 Total Assets (A)=(1+11): 1,934,129,881 1,530,809,740 13.00 14.00 121,875,000 7,143,605 140,156,250 7,143,605 37,588,366 542.989,305 727,877,526 15.00 425,054,997 554,073,602 16.00 326,089.784 326,089,784 326,089,784 326,089,784 SHAREHOLDERS' EQUITY & LIABILITIES: III. Shareholders' Equity: Share Capital Revaluation Reserve FVOCI reserve Retained Earnings Total Shareholders' Equity: IV. Non-Current Liabilities: Long Term Loan Total Non-Current Liabilities: v. Current Liabilities: Short Term Loan Sundry Creditors Dividend Payable Provision for Gratuity Deferred Tax Liability Total Current Liabilities: Total Shareholders' Equity & Liabilities (B)-(111+IV+ V): Contingent Liability Net Asset Value (NAVY/Total No. of Shares Per Value (Tk.) Accrued Liabilities 17.00 18.00 19.00 20.00 21.00 22.00 142,909,410 313,551,201 362,284,032 15,024,180 15.963,367 30,430,380 880,162,570 1.934,129,881 268,101,570 30,888,539 404.740.938 155,485.384 13.733.281 16,780.235 29,017,977 650,646.354 1.530,809,740 268,101,570 39.53 10 23.00 51.93 10 1.00 The Annexed notes from 01 to 40 form an integral part of the financial statements. 2.00 Figures have been rounded off to the nearest taka. 3.00 Previous year's figures have been rearranged for comparison, where required. Sd- Sd - Sd- Managing Director Director Company Secretary Signed in terms of our separate report of even date annexed. Sd/- Dated, Dhaka (Toha Khan Zaman & Co.) 31 October 2018 Chartered Accountants KOHINOOR CHEMICAL COMPANY (BANGLADESH) LTD. STATEMENT OF CHANGES IN EQUITY FOR THE YEAR ENDED JUNE 30, 2018 (Figures in BDT) PARTICULARS Share Capital Revaluation FVOCI Retained Total Equity Reserve reserve Earnings Year 2017-2018: Balance as at 01 July 2017 121,875,000 7,143,605 0 425,054,997 554,073.602 Add: Net Profit after Tax 0 0 0154,496,808 154,496,808 Add: Unrealized Gain on quoted shares 37,388,366 37,588,366 Less: 15% Cash dividend for the year 2016-2017 0 0 0|(18,281,250) (18.281.250) Less: 15% Stock Dividend for the year 2016-2017 18,281,250 0 0|(18,281,250) Balance at the end of the year 30 June 2018 140,156,250 7,143,605 37,588.366 542,989,305 727,877,526 Year 2016-2017: Balance as at 01 July 2016 101,562,500 7,143,605 Add: Net Profit after Tax 0 0 Less: 10% Cash dividend for the year 2015-2016 0 0 Less: 20% Stock Dividend for the year 2015-2016 20,312,500 0 Balance at the end of the year 30 June 2017 121,875,000 7,143,605 0308,728,142 417,434,247 0146,795,605 146,795,605 0|(10,156,250) (10.156,250) 0|(20,312,500) 0425,054,997 554,073,602 1.00 The Annexed notes from 01 to 40 form an integral part of the financial statements. 2.00 Figures have been rounded off to the nearest taka. 3.00 Previous year's figures have been rearranged for comparison, where required. Sd - Managing Director Sd/- Director Sd - Company Secretary Signed in terms of our separate report of even date annexed. Dated, Dhaka 31 October 2018 Sd/- (Toha Khan Zaman & Co.) Chartered Accountants KOHINOOR CHEMICAL COMPANY (BANGLADESH) LTD. STATEMENT OF PROFIT OR LOSS AND OTHER COMPREHENSIVE INCOME FOR THE YEAR ENDED 30 JUNE 2018 (Figures in BDT) NOTE AS AT 30-06-2018 AS AT 30-06-2017 PARTICULARS 24.00 25.00 3,661,324,088 (3,003,180,758) 658,143,330 3,393,185,456 (2,784,391,769) 608,793,687 26.00 27.00 Turnover (Net of VAT) Less: Cost of Goods Sold Gross Profit: Less: Operating Expenses: General & Administrative Expenses Marketing, Selling & Distribution Expenses Total Operating Expenses: Operating Profit: Less: Financial Expenses Less: Impairment Charge on Goodwill Net Profit after Financial Expenses Income from Other Sources Net Profit before Contribution to WPPF Less: Contribution to WPPF and Welfare Fund Net Profit before Tax: Less: Provision for Income Tax @ 25% Deferred Tax Income/(Expense) Net profit after tax for the year 28.00 5.00 59,044,957 369,289,894 428,334,851 229,808,479 (7,637,229) (7,144,400) 215,026,850 6,945,587 221,972,437 (10.570.116) 211,402,321 (55,493,109) (1.412,404) 154,496,808 54,883,450 345,362,350 400,245,800 208.547,887 (7,759,766) (2,381,466) 198,406,655 7,851.077 206,257,732 (9,821.797) 196,435,935 (50,572,553) 932.223 146,795,605 29,00 30.00 31.00 32.00 154,496,808 146,795,605 Other Comprehensive Income: Net profit after tax for the year Item that will not be reclassified to profit or loss: Unrealized Gain on quoted shares Total Comprehensive Income for the year No. of Shares Earnings per Share (EPS): 37,588,366 192,085,174 14,015,625 11.02 0 146,795,605 14,015.625 10.47 33.00 1.00 The Annexed notes from 01 to 40 form an integral part of the financial statements. 2.00 Figures have been rounded off to the nearest taka. 3.00 Previous year's figures have been rearranged for comparison, where required. Sd/- Managing Director Sd/- Director Sd/- Company Secretary Signed in terms of our separate report of even date annexed. Dated, Dhaka 31 October 2018 Sd/- (Toha Khan Zaman & Co.) Chartered Accountants