Answered step by step
Verified Expert Solution
Question
1 Approved Answer
Calculate the following ratios debt to equity ratio debt to asset ratio debt service coverage ratio interest coverage ratio fixed asset turn over ratio inventory
Calculate the following ratios
debt to equity ratio
debt to asset ratio
debt service coverage ratio
interest coverage ratio
fixed asset turn over ratio
inventory turnover ratio
working capital turnover ratio
payable turnover ratio
cash conversion cycle ratio


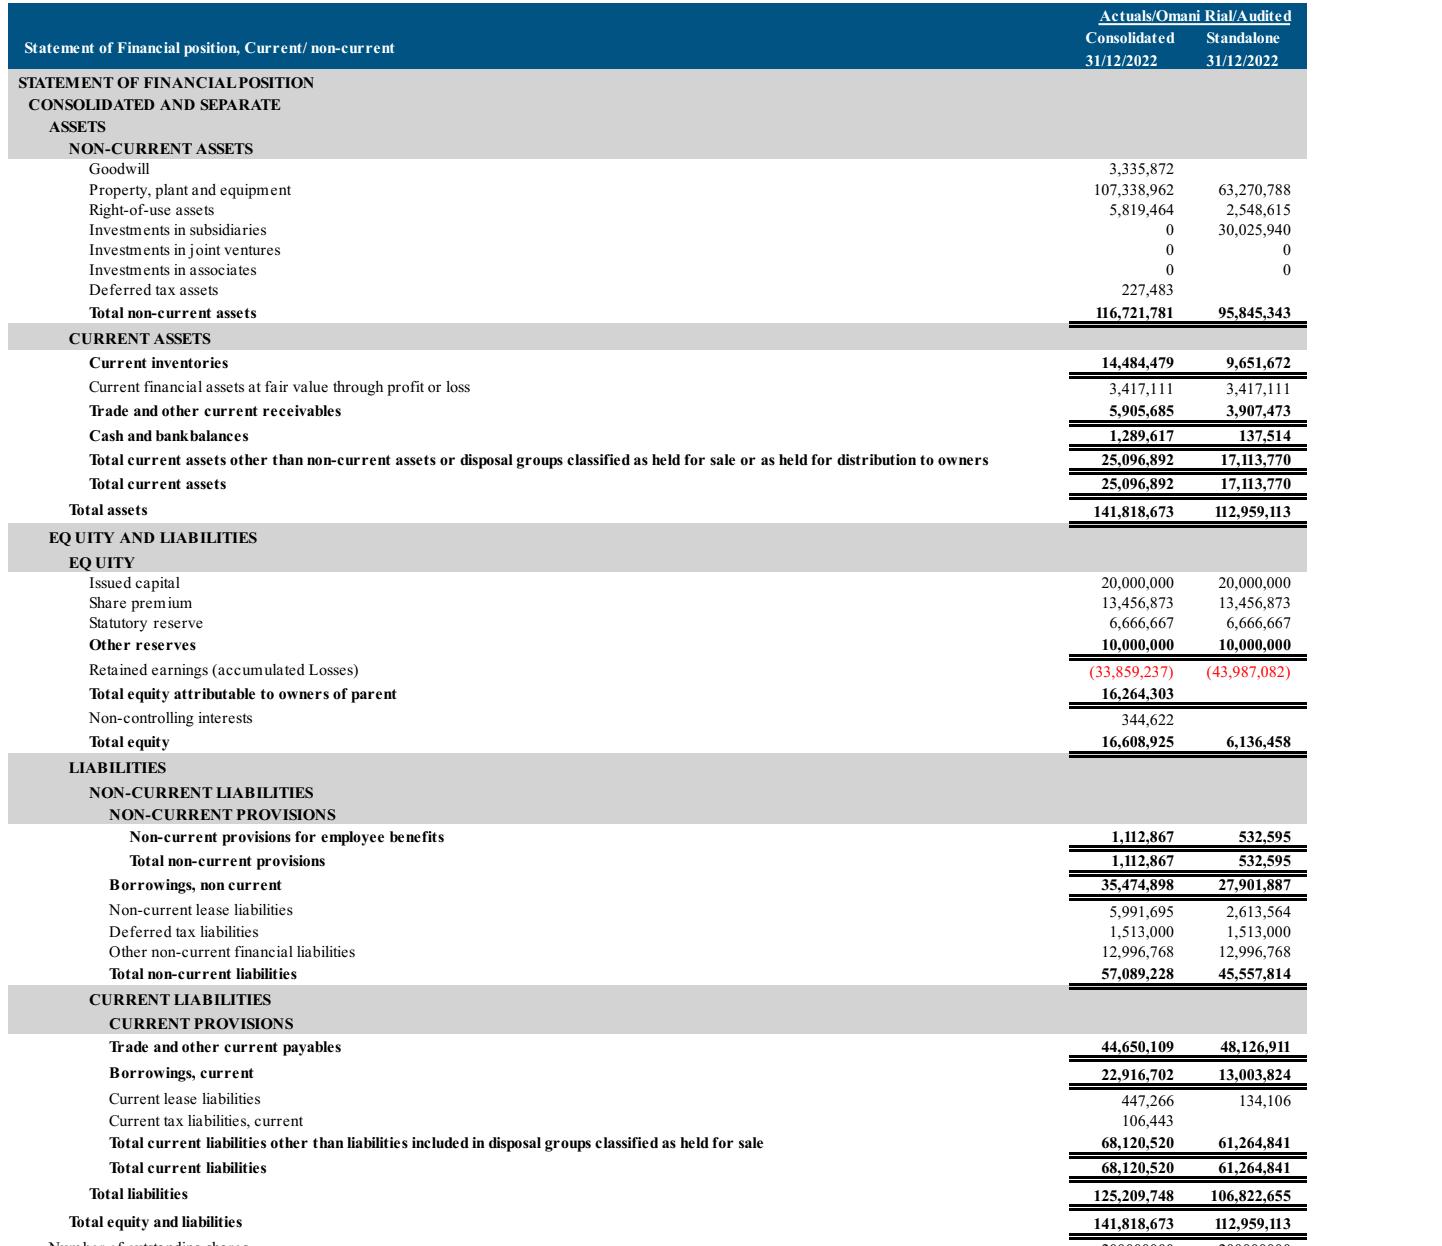
Statement of Financial position, Current/ non-current STATEMENT OF FINANCIAL POSITION CONSOLIDATED AND SEPARATE ASSETS NON-CURRENT ASSETS Goodwill Property, plant and equipment Right-of-use assets Investments in subsidiaries Investments in joint ventures Investments in associates Deferred tax assets Total non-current assets CURRENT ASSETS Current inventories Current financial assets at fair value through profit or loss Trade and other current receivables Cash and bank balances Total current assets other than non-current assets or disposal groups classified as held for sale or as held for distribution to owners Total current assets Total assets EQUITY AND LIABILITIES EQUITY Issued capital Share premium Statutory reserve Other reserves Retained earnings (accumulated Losses) Total equity attributable to owners of parent Non-controlling interests Total equity LIABILITIES NON-CURRENT LIABILITIES NON-CURRENT PROVISIONS Non-current provisions for employee benefits Total non-current provisions Borrowings, non current Non-current lease liabilities Deferred tax liabilities Other non-current financial liabilities. Total non-current liabilities CURRENT LIABILITIES CURRENT PROVISIONS Trade and other current payables Borrowings, current Current lease liabilities. Current tax liabilities, current Total current liabilities other than liabilities included in disposal groups classified as held for sale Total current liabilities Total liabilities Total equity and liabilities Actuals/Omani Rial/Audited Consolidated Standalone 31/12/2022 31/12/2022 3,335,872 107,338,962 5,819,464 0 0 0 227,483 116,721,781 14,484,479 3,417,111 5,905,685 1,289,617 25,096,892 25,096,892 141,818,673 20,000,000 13,456,873 6,666,667 10,000,000 344,622 16,608,925 1,112,867 1,112,867 35,474,898 5,991,695 1,513,000 12,996,768 57,089,228 44,650,109 22,916,702 447,266 106,443 68,120,520 68,120,520 125,209,748 141,818,673 63,270,788 2,548,615 30,025,940 (33,859,237) (43,987,082) 16,264.303 200000000 0 95,845,343 9,651,672 3,417,111 3,907,473 137,514 17,113,770 17,113,770 112,959,113 20,000,000 13,456,873 6,666,667 10,000,000 6,136,458 532,595 532,595 27,901,887 2,613,564 1,513,000 12,996,768 45,557,814 48,126,911 13,003,824 134,106 61,264,841 61,264,841 106,822,655 112,959,113
Step by Step Solution
★★★★★
3.41 Rating (154 Votes )
There are 3 Steps involved in it
Step: 1
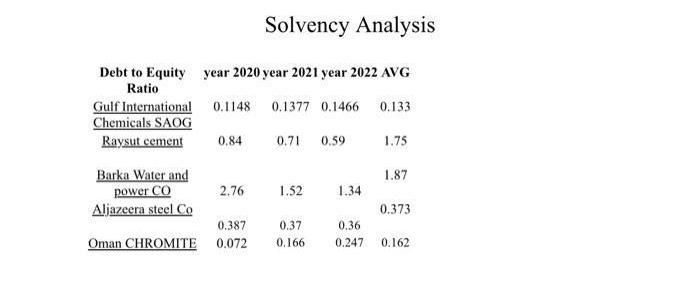
SOLUTION To calculate the requested financial ratios well use the information provided in the Statement of Financial Position Here are the calculations Debt to Equity Ratio Gulf International Chemical...
Get Instant Access to Expert-Tailored Solutions
See step-by-step solutions with expert insights and AI powered tools for academic success
Step: 2

Step: 3

Ace Your Homework with AI
Get the answers you need in no time with our AI-driven, step-by-step assistance
Get Started


