

Question
Calculate the following ratios for Lake of Egypt Marina, Inc. as of year-end 2018. (Use sales when computing the inventory turnover and use total equity
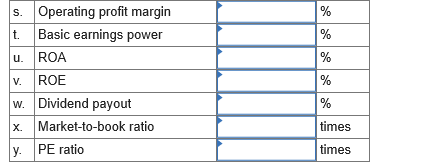
Calculate the following ratios for Lake of Egypt Marina, Inc. as of year-end 2018. (Use sales when computing the inventory turnover and use total equity when computing the equity multiplier. Round your answers to 2 decimal places. Use 365 days a year.)
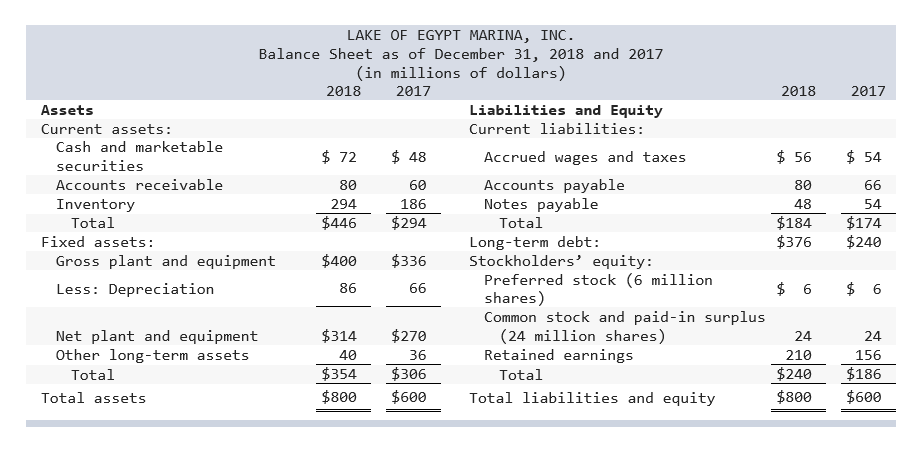
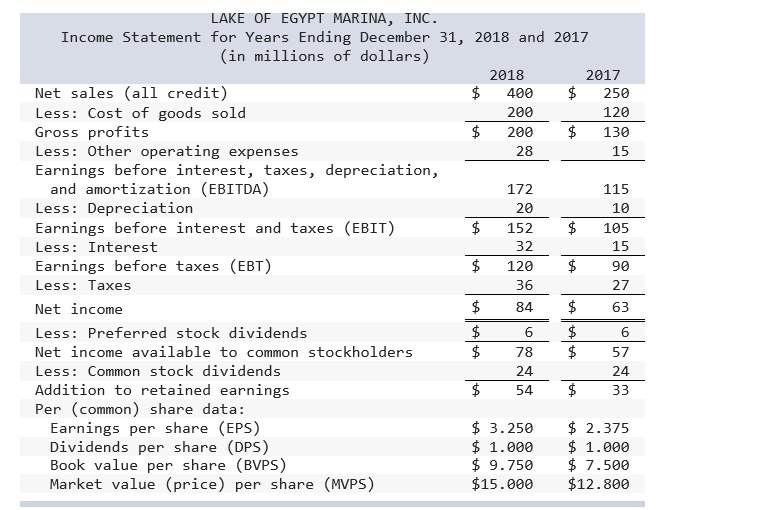
LAKE OF EGYPT MARINA, INC. Balance Sheet as of December 31, 2018 and 2017 (in millions of dollars) 2018 2017 2018 2017 Assets Liabilities and Equity Current assets: Current liabilities: Cash and marketable $ 72 $ 48 Accrued wages and taxes $ 56 $ 54 securities Accounts receivable 80 60 Accounts payable 8066 Inventory 294 186 Notes payable 4854 Total $446 $294 Total $184 $174 Fixed assets: Long-term debt: $376 $240 Gross plant and equipment $400 $336 Stockholders' equity: 86 Less: Depreciation Preferred stock (6 million 66 shares) Common stock and paid-in surplus Net plant and equipment $314 $270 (24 million shares) 24 24 Other long-term assets 40 36 Retained earnings 210 156 Total $354 $306 Total $240 $186 Total assets $800 $600 Total liabilities and equity $800 $600 28 15 10 15 LAKE OF EGYPT MARINA, INC. Income Statement for Years Ending December 31, 2018 and 2017 (in millions of dollars) 2018 2017 Net sales (all credit) $ 400 $ 250 Less: Cost of goods sold 200 120 Gross profits 200 130 Less: Other operating expenses Earnings before interest, taxes, depreciation, and amortization (EBITDA) 172 115 Less: Depreciation 20 Earnings before interest and taxes (EBIT) 105 Less: Interest Earnings before taxes (EBT) Less: Taxes Net income $ 84 $ 63 Less: Preferred stock dividends $ 6 $ 6 Net income available to common stockholders $ 78 $ 57 Less: Common stock dividends Addition to retained earnings $ 54 $ 33 Per (common) share data: Earnings per share (EPS) $ 3.250 $ 2.375 Dividends per share (DPS) $ 1.000 $ 1.000 Book value per share (BVPS) $ 9.750 $ 7.500 Market value (price) per share (MVPS) $15.000 $12.800 s. u. Operating profit margin Basic earnings power ROA ROE Dividend payout Market-to-book ratio PE ratio times times yStep by Step Solution
There are 3 Steps involved in it
Step: 1

Get Instant Access to Expert-Tailored Solutions
See step-by-step solutions with expert insights and AI powered tools for academic success
Step: 2

Step: 3
Ace Your Homework with AI
Get the answers you need in no time with our AI-driven, step-by-step assistance
Get Started
The Smart Investors Survival Guide
Authors: Charles Carlson
1st Edition
0385503873, 978-0385503877