Answered step by step
Verified Expert Solution
Link Copied!

Question

1 Approved Answer

Calculate the frequency and cumulative distributions for the number of errors for each office. Let's say that the department's goal is for at least 50

  1. Calculate the frequency and cumulative distributions for the number of errors for each office. Let's say that the department's goal is for at least 50 percent of each office's tests to find no more than five errors. Which office or offices meet this performance benchmark, and which don't? Explain your findings.
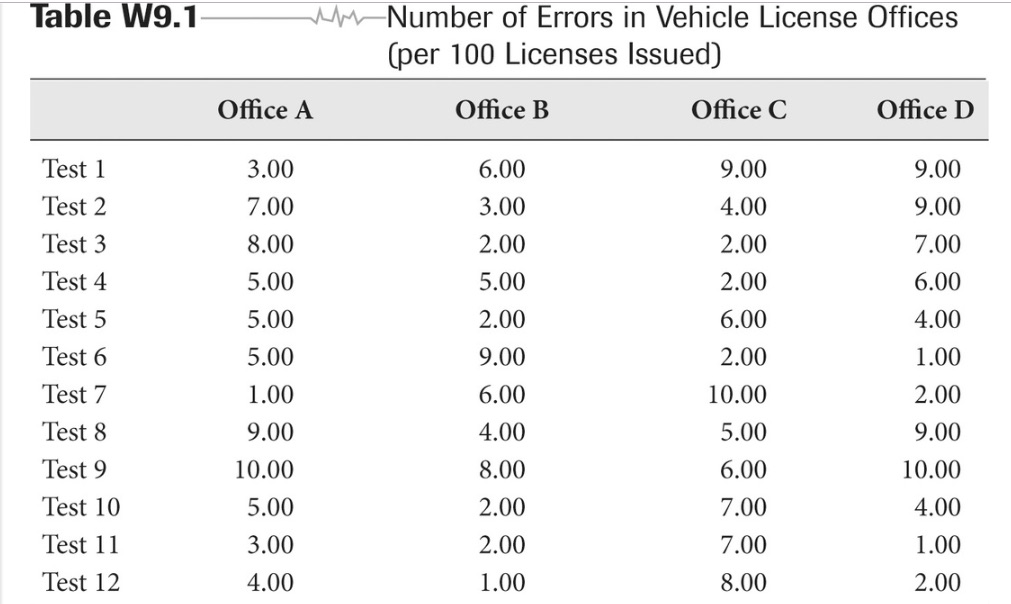
image text in transcribed
Table W/9. 7 ~`- Number of Errors in Vehicle License Offices ( per 100 Licenses Issued ) Office A Office B Office C Office D Test ! 3. 00 6. 00 9. 00 9. 00 Test 2 7. 00 3. 00 4. 00 9.00 Test 3 8. 00 2. 00 2. 00 7. 00 Test 4 5. 00 5. 00 2.00 6.00 Test 5 5. 00 2. 00 6. 00 4. 00 Test 6 5. 00 9. 00 2. 00 1. 00 Test 7 1. 00 6. 00 10. 00 2.00 Test 8 9.00 4. 00 5. 00 9.00 Test 9 10. 00 8. 00 6. 00 10. 00 Test 10 5. 00 2. 00 7. 00 4. 00 Test 1 1 3. 00 2.00 7. 00 1. 00 Test 12 4. 00 1. 00 8. 00 2. 00

Step by Step Solution

There are 3 Steps involved in it

Step: 1

blur-text-image

Get Instant Access to Expert-Tailored Solutions

See step-by-step solutions with expert insights and AI powered tools for academic success

Step: 2

blur-text-image

Step: 3

blur-text-image

Ace Your Homework with AI

Get the answers you need in no time with our AI-driven, step-by-step assistance

Get Started

Recommended Textbook for

Essential Calculus Early Transcendental Functions

Authors: Ron Larson, Robert P. Hostetler, Bruce H. Edwards

1st Edition

618879188, 618879182, 978-0618879182

More Books

Students also viewed these Mathematics questions

Question

Why are pricing decisions so important to a business?

Answered: 1 week ago