

Answered step by step
Verified Expert Solution
Question
1 Approved Answer
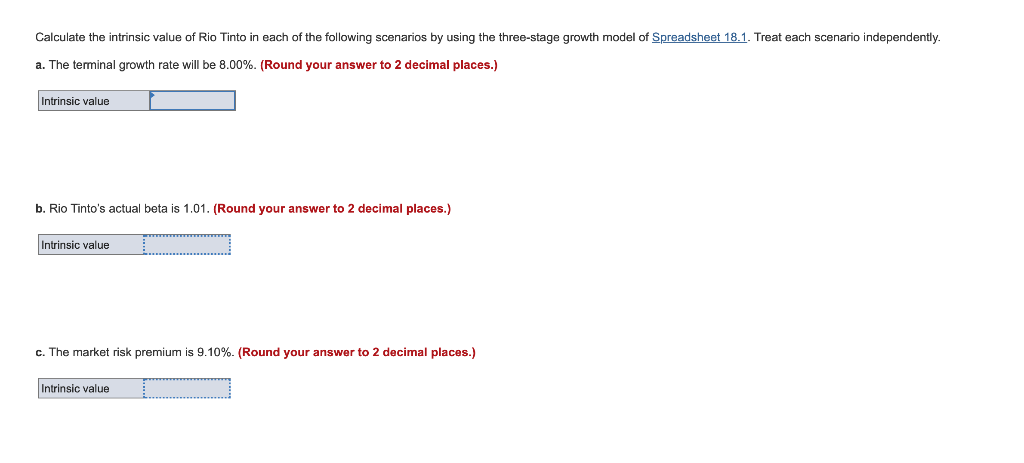
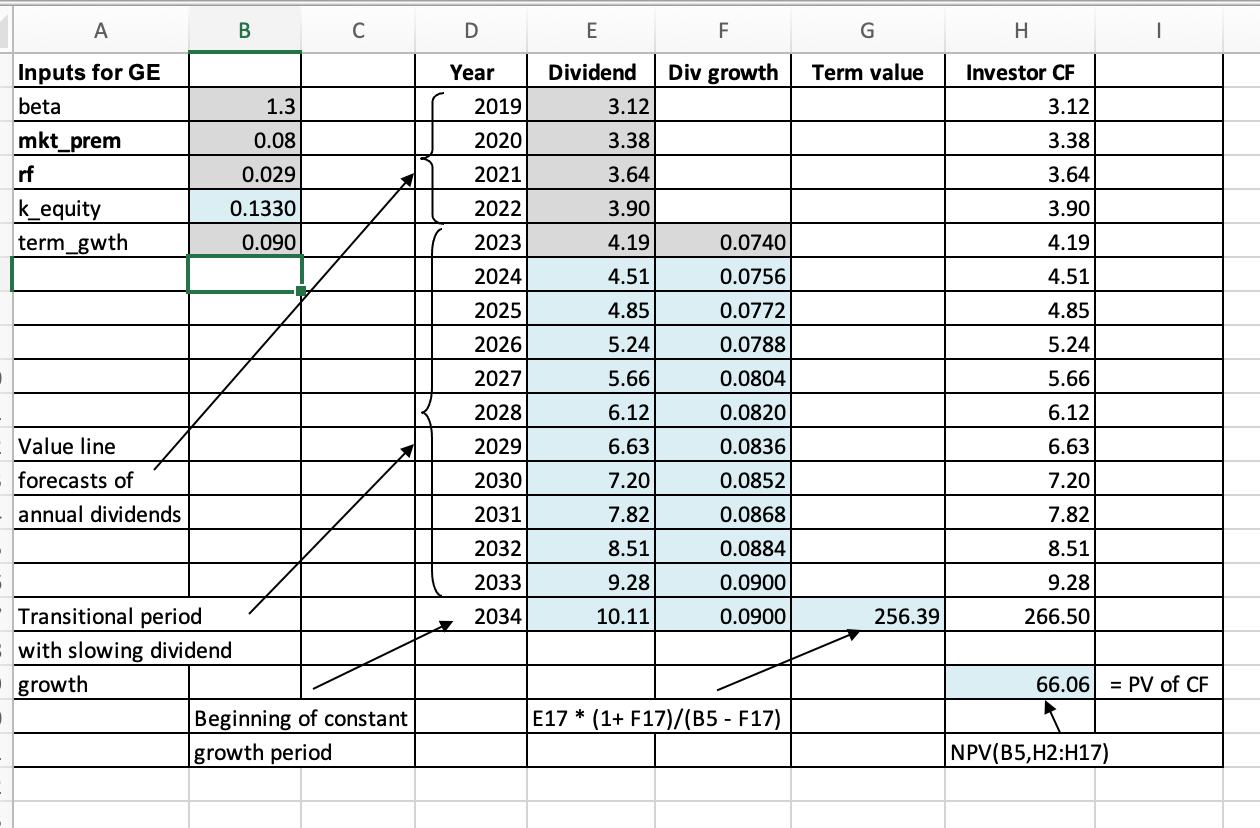
Calculate the intrinsic value of Rio Tinto in each of the following scenarios by using the three-stage growth model of Spreadsheet 18.1. Treat each scenario
Step by Step Solution
There are 3 Steps involved in it
Step: 1

Get Instant Access to Expert-Tailored Solutions
See step-by-step solutions with expert insights and AI powered tools for academic success
Step: 2

Step: 3
Ace Your Homework with AI
Get the answers you need in no time with our AI-driven, step-by-step assistance
Get Started
Applied Equity Analysis and Portfolio Management Tools to Analyze and Manage Your Stock Portfolio
Authors: Robert A.Weigand
1st edition
978-111863091, 1118630912, 978-1118630914