Answered step by step
Verified Expert Solution
Question
1 Approved Answer
Generate 100 random data points from some hypothetical climate variable x~N(2,2) - in other words, from a normal distribution with u = 2 and

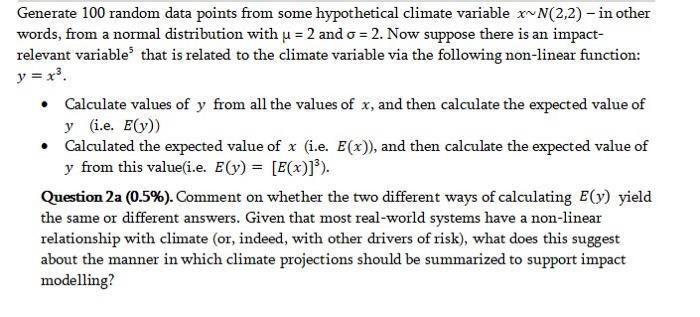
Generate 100 random data points from some hypothetical climate variable x~N(2,2) - in other words, from a normal distribution with u = 2 and o = 2. Now suppose there is an impact- relevant variable that is related to the climate variable via the following non-linear function: y = x. Calculate values of y from all the values of x, and then calculate the expected value of y (i.e. E(y)) Calculated the expected value of x (i.e. E(x)), and then calculate the expected value of y from this value(i.e. E(y) = [E(x)]). Question 2a (0.5%). Comment on whether the two different ways of calculating E(y) yield the same or different answers. Given that most real-world systems have a non-linear relationship with climate (or, indeed, with other drivers of risk), what does this suggest about the manner in which climate projections should be summarized to support impact modelling?
Step by Step Solution
★★★★★
3.40 Rating (187 Votes )
There are 3 Steps involved in it
Step: 1
To generate 100 random data points from a nor...
Get Instant Access to Expert-Tailored Solutions
See step-by-step solutions with expert insights and AI powered tools for academic success
Step: 2

Step: 3

Ace Your Homework with AI
Get the answers you need in no time with our AI-driven, step-by-step assistance
Get Started


