 Calculate the monthly log returns for the stocks in the industries you are working on. What is the annualized variance-covariance matrix? What about mean returns? Given risk-free rate as 3%, what is the Sharpe ratio for the optimal risky portfolio? Assume there is no constraint. Hint: when the constant is equal to risk-free rate, the theta in our lecture is the Sharpe ratio. With the weight for each stock in the optimal risky portfolio, get the historical monthly returns for this optimal risky portfolio. Plot the frequency distribution of the returns. Assume the bins are from -20% to 20%, with a step size of 2%. What kind of distribution does it look like? Assume the initial value of this portfolio is $1,000 in December 2012, what is the ending value in December 2021? Now assume there are two constraints in your portfolio, which are imposed by the company's investment policy: (1) the weight in each stock should not be less than 5% or over 50%; and (2) the weight in each industry should not be less than 20%. With such constraints, what is the Sharpe ratio for your optimal risky portfolio? In our lectures and assignment, we've tested CAPM/SML, and it seems the CAPM/SML does not hold in our cases. Briefly list two possible reasons why CAPM/SML does not hold.
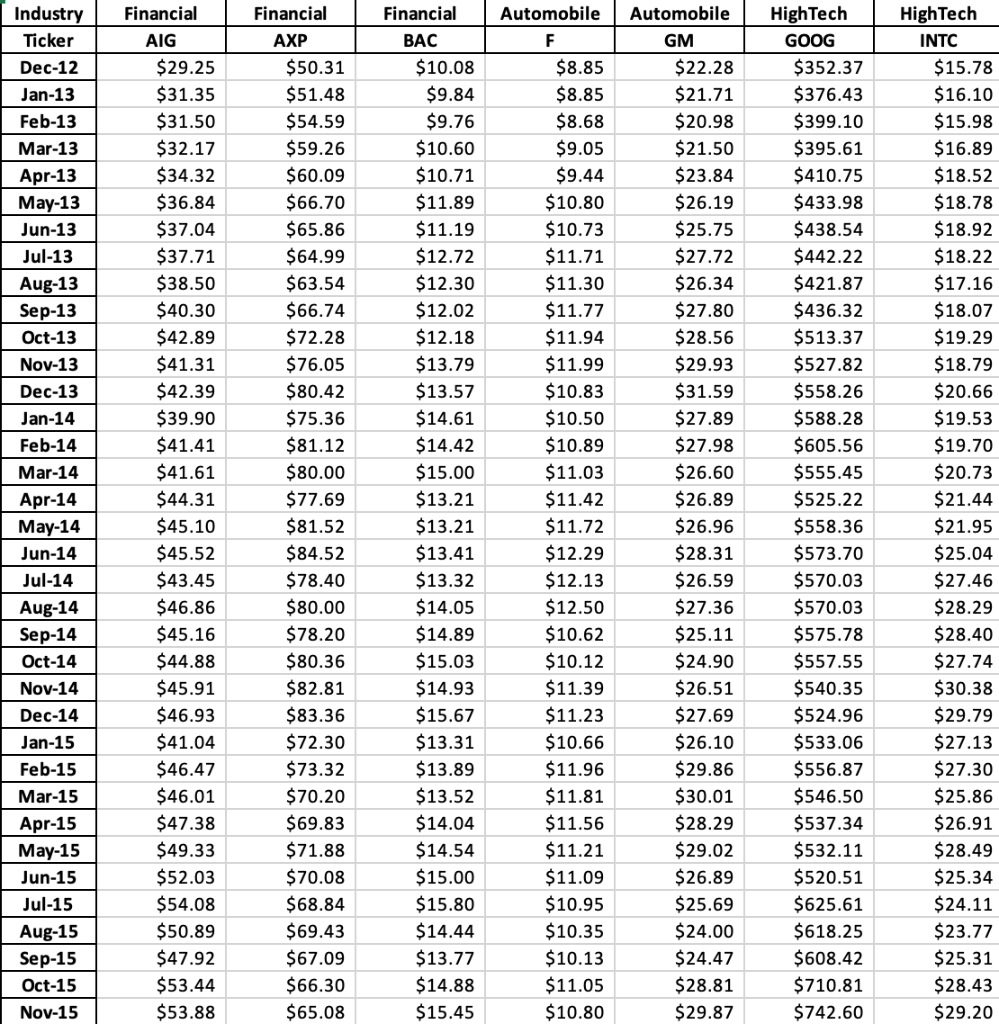
Industry Financial Ticker AIG Dec-12 Jan-13 Feb-13 Mar-13 Apr-13 May-13 Jun-13 Jul-13 Aug-13 Sep-13 Oct-13 Nov-13 Dec-13 Jan-14 Feb-14 Mar-14 Apr-14 May-14 Jun-14 Jul-14 Aug-14 Sep-14 Oct-14 Nov-14 Dec-14 Jan-15 Feb-15 Mar-15 Apr-15 May-15 Jun-15 Jul-15 Aug-15 Sep-15 Oct-15 Nov-15 $29.25 $31.35 $31.50 $32.17 $34.32 $36.84 $37.04 $37.71 $38.50 $40.30 $42.89 $41.31 $42.39 $39.90 $41.41 $41.61 $44.31 $45.10 $45.52 $43.45 $46.86 $45.16 $44.88 $45.91 $46.93 $41.04 $46.47 $46.01 $47.38 $49.33 $52.03 $54.08 $50.89 $47.92 $53.44 $53.88 Financial AXP $50.31 $51.48 $54.59 $59.26 $60.09 $66.70 $65.86 $64.99 $63.54 $66.74 $72.28 $76.05 $80.42 $75.36 $81.12 $80.00 $77.69 $81.52 $84.52 $78.40 $80.00 $78.20 $80.36 $82.81 $83.36 $72.30 $73.32 $70.20 $69.83 $71.88 $70.08 $68.84 $69.43 $67.09 $66.30 $65.08 Financial BAC $10.08 $9.84 $9.76 $10.60 $10.71 $11.89 $11.19 $12.72 $12.30 $12.02 $12.18 $13.79 $13.57 $14.61 $14.42 $15.00 $13.21 $13.21 $13.41 $13.32 $14.05 $14.89 $15.03 $14.93 $15.67 $13.31 $13.89 $13.52 $14.04 $14.54 $15.00 $15.80 $14.44 $13.77 $14.88 $15.45 Automobile Automobile HighTech F GM GOOG $8.85 $22.28 $8.85 $21.71 $8.68 $20.98 $9.05 $21.50 $9.44 $23.84 $10.80 $26.19 $10.73 $25.75 $11.71 $27.72 $11.30 $26.34 $11.77 $27.80 $11.94 $28.56 $11.99 $29.93 $10.83 $31.59 $10.50 $27.89 $10.89 $27.98 $11.03 $26.60 $11.42 $26.89 $11.72 $26.96 $12.29 $28.31 $12.13 $26.59 $12.50 $27.36 $10.62 $25.11 $10.12 $24.90 $11.39 $26.51 $11.23 $27.69 $10.66 $26.10 $11.96 $29.86 $11.81 $30.01 $11.56 $28.29 $11.21 $29.02 $11.09 $26.89 $10.95 $25.69 $10.35 $24.00 $10.13 $24.47 $11.05 $28.81 $10.80 $29.87 $352.37 $376.43 $399.10 $395.61 $410.75 $433.98 $438.54 $442.22 $421.87 $436.32 $513.37 $527.82 $558.26 $588.28 $605.56 $555.45 $525.22 $558.36 $573.70 $570.03 $570.03 $575.78 $557.55 $540.35 $524.96 $533.06 $556.87 $546.50 $537.34 $532.11 $520.51 $625.61 $618.25 $608.42 $710.81 $742.60 HighTech INTC $15.78 $16.10 $15.98 $16.89 $18.52 $18.78 $18.92 $18.22 $17.16 $18.07 $19.29 $18.79 $20.66 $19.53 $19.70 $20.73 $21.44 $21.95 $25.04 $27.46 $28.29 $28.40 $27.74 $30.38 $29.79 $27.13 $27.30 $25.86 $26.91 $28.49 $25.34 $24.11 $23.77 $25.31 $28.43 $29.20 Industry Financial Ticker AIG Dec-12 Jan-13 Feb-13 Mar-13 Apr-13 May-13 Jun-13 Jul-13 Aug-13 Sep-13 Oct-13 Nov-13 Dec-13 Jan-14 Feb-14 Mar-14 Apr-14 May-14 Jun-14 Jul-14 Aug-14 Sep-14 Oct-14 Nov-14 Dec-14 Jan-15 Feb-15 Mar-15 Apr-15 May-15 Jun-15 Jul-15 Aug-15 Sep-15 Oct-15 Nov-15 $29.25 $31.35 $31.50 $32.17 $34.32 $36.84 $37.04 $37.71 $38.50 $40.30 $42.89 $41.31 $42.39 $39.90 $41.41 $41.61 $44.31 $45.10 $45.52 $43.45 $46.86 $45.16 $44.88 $45.91 $46.93 $41.04 $46.47 $46.01 $47.38 $49.33 $52.03 $54.08 $50.89 $47.92 $53.44 $53.88 Financial AXP $50.31 $51.48 $54.59 $59.26 $60.09 $66.70 $65.86 $64.99 $63.54 $66.74 $72.28 $76.05 $80.42 $75.36 $81.12 $80.00 $77.69 $81.52 $84.52 $78.40 $80.00 $78.20 $80.36 $82.81 $83.36 $72.30 $73.32 $70.20 $69.83 $71.88 $70.08 $68.84 $69.43 $67.09 $66.30 $65.08 Financial BAC $10.08 $9.84 $9.76 $10.60 $10.71 $11.89 $11.19 $12.72 $12.30 $12.02 $12.18 $13.79 $13.57 $14.61 $14.42 $15.00 $13.21 $13.21 $13.41 $13.32 $14.05 $14.89 $15.03 $14.93 $15.67 $13.31 $13.89 $13.52 $14.04 $14.54 $15.00 $15.80 $14.44 $13.77 $14.88 $15.45 Automobile Automobile HighTech F GM GOOG $8.85 $22.28 $8.85 $21.71 $8.68 $20.98 $9.05 $21.50 $9.44 $23.84 $10.80 $26.19 $10.73 $25.75 $11.71 $27.72 $11.30 $26.34 $11.77 $27.80 $11.94 $28.56 $11.99 $29.93 $10.83 $31.59 $10.50 $27.89 $10.89 $27.98 $11.03 $26.60 $11.42 $26.89 $11.72 $26.96 $12.29 $28.31 $12.13 $26.59 $12.50 $27.36 $10.62 $25.11 $10.12 $24.90 $11.39 $26.51 $11.23 $27.69 $10.66 $26.10 $11.96 $29.86 $11.81 $30.01 $11.56 $28.29 $11.21 $29.02 $11.09 $26.89 $10.95 $25.69 $10.35 $24.00 $10.13 $24.47 $11.05 $28.81 $10.80 $29.87 $352.37 $376.43 $399.10 $395.61 $410.75 $433.98 $438.54 $442.22 $421.87 $436.32 $513.37 $527.82 $558.26 $588.28 $605.56 $555.45 $525.22 $558.36 $573.70 $570.03 $570.03 $575.78 $557.55 $540.35 $524.96 $533.06 $556.87 $546.50 $537.34 $532.11 $520.51 $625.61 $618.25 $608.42 $710.81 $742.60 HighTech INTC $15.78 $16.10 $15.98 $16.89 $18.52 $18.78 $18.92 $18.22 $17.16 $18.07 $19.29 $18.79 $20.66 $19.53 $19.70 $20.73 $21.44 $21.95 $25.04 $27.46 $28.29 $28.40 $27.74 $30.38 $29.79 $27.13 $27.30 $25.86 $26.91 $28.49 $25.34 $24.11 $23.77 $25.31 $28.43 $29.20