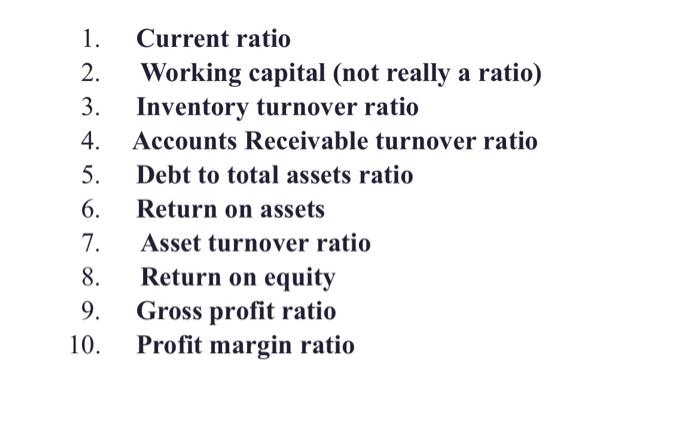
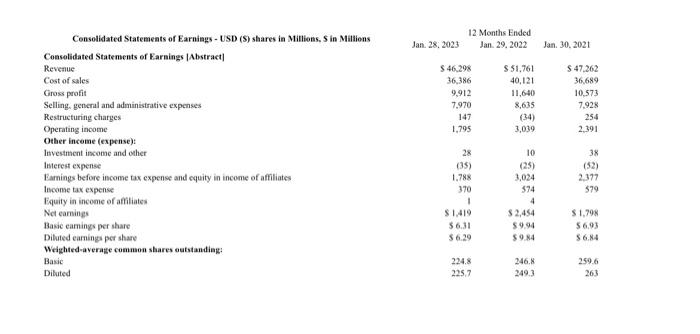
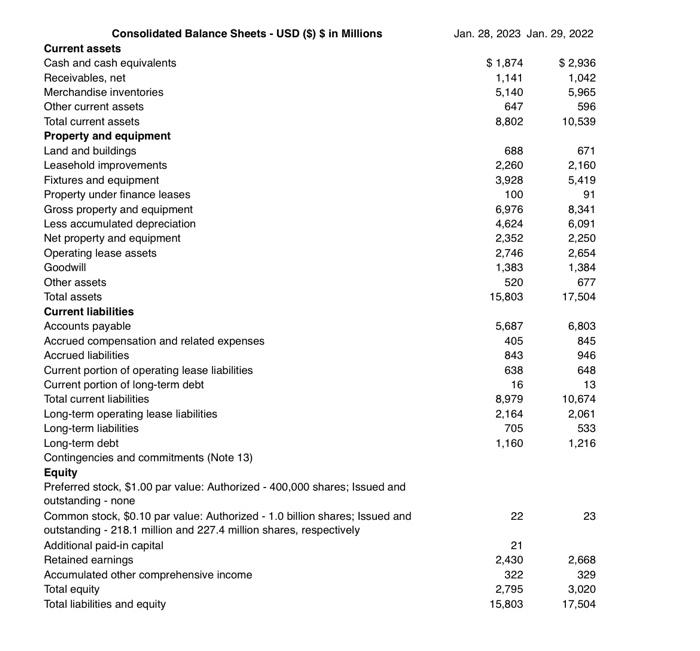
Calculate the most recent two years' ratios below
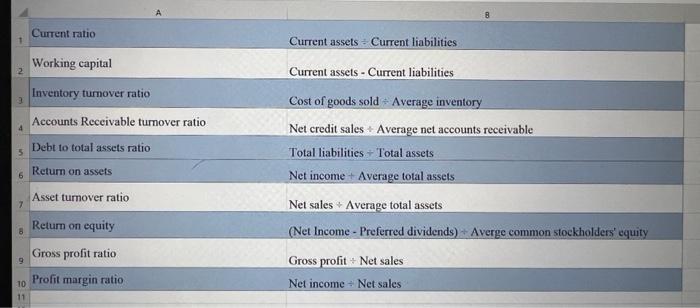
(equations attached)
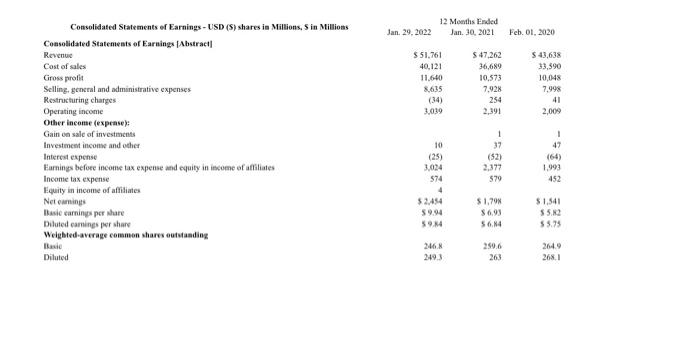
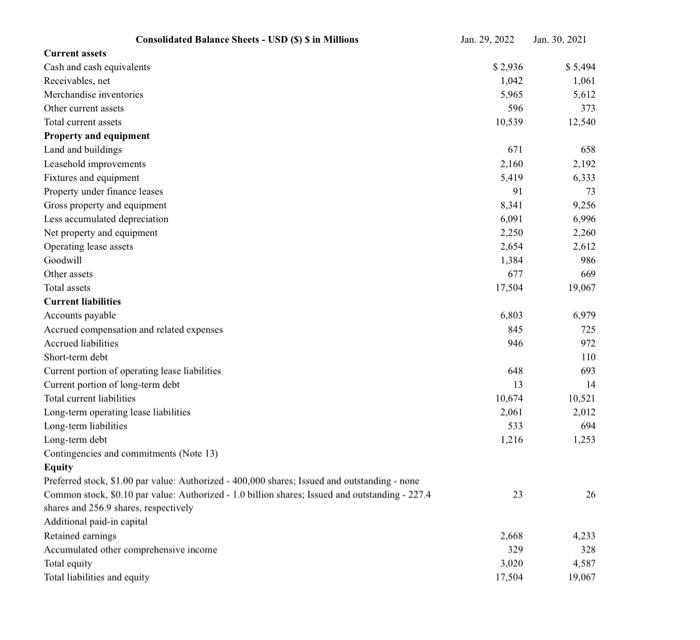
balance sheets and income statements are attached)
1. Current ratio 2. Working capital (not really a ratio) Inventory turnover ratio 3. 4. Accounts Receivable turnover ratio 5. Debt to total assets ratio 6. Return on assets 7. Asset turnover ratio 8. Return on equity 9. Gross profit ratio 10. Profit margin ratio
1. Current ratio 2. Working capital (not really a ratio) 3. Inventory turnover ratio 4. Accounts Receivable turnover ratio 5. Debt to total assets ratio 6. Return on assets 7. Asset turnover ratio 8. Return on equity 9. Gross profit ratio 10. Profit margin ratio Curent ratio Current assets Current liabilities Working capital Current assets - Current liabilities Inventory turnover ratio Cost of goods sold Average inventory Accounts Receivable turnover ratio Net credit sales + Average net accounts receivable Debt to total assets ratio Total liabilities + Total assets Return on assets Net income + Average total assets Asset tumover ratio Net sales Average total assets Return on equity (Net Income - Preferred dividends) - Averge common stockholders' equity Gross profit ratio Gross profit Net sales Profit margin ratio Net income Net sales Consolidated Statements of Earnings - USD (\$) shares is Millions, 5 in Millions Consolidated Statements of Earnings [Nbstract] Revenue Cost of sales Gross profia Selling, general and administrative expenses Restructuring charges Operating income Other income (expease): Gain on sale of investments Investment inconse and other Intercst expense Farnings before income tax expense and equity in iscome of affliates Income tax expense Fquity in income of affitiates Net eamings Itasie carninys per share Diluted carnings per share Weighted-average comanon shars outsanding Dasie Diluted Jan.29,2022 12 Moenths Finded Jan. 30,2021 Feb. 01, 2020 \begin{tabular}{|c|c|c|} \hline$51.761 & $47,262 & $43,638 \\ \hline 40,121 & 36,689 & 33,590 \\ \hline 11,640 & 10,573 & 10,048 \\ \hline 8,635 & 7,928 & 7,998 \\ \hline (34) & 254 & 41 \\ \hline \multirow[t]{2}{*}{3,039} & 2,391 & 2,009 \\ \hline & 1 & I \\ \hline 10 & 37 & 47 \\ \hline (25) & (52) & (64) \\ \hline 3,024 & 2,377 & 1,993 \\ \hline 574 & 579 & 452 \\ \hline \multicolumn{3}{|l|}{4} \\ \hline 52,454 & 51,70w & 51,541 \\ \hline 59.94 & $6.93 & 55.82 \\ \hline 59.14 & 56,NA & 55.75 \\ \hline 246.8 & 250.6 & 2649 \\ \hline 249.3 & 263 & 268.1 \\ \hline \end{tabular} Consolidated Balance Sheets - USD (\$) $ in Millions Jan. 29,2022 Jan. 30,2021 Curreat assets Cash and cash equivalents Receivables, net Merchandise inventories Other current assets Total current assets Property and equipment Land and buildings Leasehold improvements Fixtures and equipment Property under finance leases Gross property and equipment Less accumulated depreciation Net property and equipment Operating lease assets Goodwill Other assets Total assets Current liabilities Accounts payable Accrued compensation and related expenses Accrued liabilities Short-term debt Current portion of operating lease liabilities Current portion of long-term debt Total current liabilities Long-lerm operating lease liabilities Long-term liabilities Long-term debt Contingencies and commitments (Note 13) Equity Preferred stock, \$1,00 par value: Authorized - 400,000 shares; Issued and outstanding - none Common stock, \$0. 10 par value: Authorized - 1.0 billion shares; Issued and outstanding - 227.4 shares and 256.9 shares, respectively Additional paid-in capital Retained eamings Accumulated other comprehensive income Total equity Total liabilities and equity \begin{tabular}{rr} $2,936 & $5,494 \\ 1,042 & 1,061 \\ 5,965 & 5,612 \\ 596 & 373 \\ 10,539 & 12,540 \end{tabular} \begin{tabular}{rr} 671 & 658 \\ 2,160 & 2,192 \\ 5,419 & 6,333 \\ 91 & 73 \\ 8,341 & 9,256 \\ 6,091 & 6,996 \\ 2,250 & 2,260 \\ 2,654 & 2,612 \\ 1,384 & 986 \\ 677 & 669 \\ 17,504 & 19,067 \\ & \\ 6,803 & 6,979 \\ 845 & 725 \\ 946 & 972 \\ & 110 \\ 648 & 693 \\ 13 & 14 \\ 10,674 & 10,521 \\ 2,061 & 2,012 \\ 533 & 694 \\ 1,216 & 1,253 \end{tabular} 23 26 \begin{tabular}{rr} 2,668 & 4,233 \\ 329 & 328 \\ 3,020 & 4,587 \\ 17,504 & 19,067 \end{tabular} Censolidated Statements of Earniags - USD (S) shares in Millions, 5 in Millions Consolidated Statements of Earnings [Abstract] Reveaue Cost of sales Gross profit Selling. general and administrative expenses Restructuring charges Operating income Other inceme (expense): Investment income and other Interest expense Farnings before income tax expense and equity in income of afriliates lncome tax expense Equity in income of affiliates Net eamings Basie eamings per share Dilated earning per share Weighted-averate common shares outstandiag: Basic Diluted Jan. 28.2023 12. Months Ended Jan. 29.2022 Jan. 30.2021 \begin{tabular}{rrr} $46.298 & $51,761 & $47,262 \\ 36,386 & 40,121 & 36,689 \\ 9,912 & 11,640 & 10,573 \\ 7,970 & 8,635 & 7,928 \\ 147 & (34) & 254 \\ 1,795 & 3,039 & 2,391 \\ & & \\ 28 & 10 & 38 \\ (35) & (25) & (52) \\ 1.788 & 3,024 & 2,377 \\ 370 & 574 & $79 \\ 1 & 4 & $1,798 \\ $1,419 & $2,454 & 56,93 \\ $6.31 & $9.94 & 56.84 \\ $6.29 & $9.84 & 259.6 \\ & & 263 \end{tabular} Consolidated Balance Sheets - USD (\$) \$ in Millions Current assets Cash and cash equivalents Receivables, net Merchandise inventories Other current assets Total current assets Property and equipment Land and buildings Leasehold improvements Fixtures and equipment Property under finance leases Gross property and equipment Less accumulated depreciation Net property and equipment Operating lease assets Goodwill Other assets Total assets Current liabilities Accounts payable Accrued compensation and related expenses Accrued liabilities Current portion of operating lease liabilities Current portion of long-term debt Total current liabilities Long-term operating lease liabilities Long-term liabilities Long-term debt Contingencies and commitments (Note 13) Equity Preferred stock, \$1.00 par value: Authorized - 400,000 shares; Issued and outstanding - none Common stock, $0.10 par value: Authorized - 1.0 billion shares; Issued and outstanding - 218.1 million and 227.4 million shares, respectively Additional paid-in capital Retained earnings Accumulated other comprehensive income Total equity Total liabilities and equity Jan. 28, 2023 Jan. 29, 2022 \begin{tabular}{rr} $1,874 & $2,936 \\ 1,141 & 1,042 \\ 5,140 & 5,965 \\ 647 & 596 \\ 8,802 & 10,539 \end{tabular} \begin{tabular}{rr} 688 & 671 \\ 2,260 & 2,160 \\ 3,928 & 5,419 \\ 100 & 91 \\ 6,976 & 8,341 \\ 4,624 & 6,091 \\ 2,352 & 2,250 \\ 2,746 & 2,654 \\ 1,383 & 1,384 \\ 520 & 677 \\ 15,803 & 17,504 \\ & \\ 5,687 & 6,803 \\ 405 & 845 \\ 843 & 946 \\ 638 & 648 \\ 16 & 13 \\ 8,979 & 10,674 \\ 2,164 & 2,061 \\ 705 & 533 \\ 1,160 & 1,216 \end{tabular} \begin{tabular}{rr} 21 & \\ 2,430 & 2,668 \\ 322 & 329 \\ 2,795 & 3,020 \\ 15,803 & 17,504 \end{tabular}