

Question
Calculate the nominal and real annual rate of housing price appreciation rate for Miami and for Houston for the requested different time periods using the
Calculate the nominal and real annual rate of housing price appreciation rate for Miami and for Houston for the requested different time periods using the housing price index data and the inflation index data provided to you in tab A ?of the Excel spreadsheet.
a ?In total, you need to calculate ?values that will appear in the ?yellow cells of that Excel tab.
bWhat can you say about the magnitude and the volatility of housing price appreciation in the short, medium and long run?
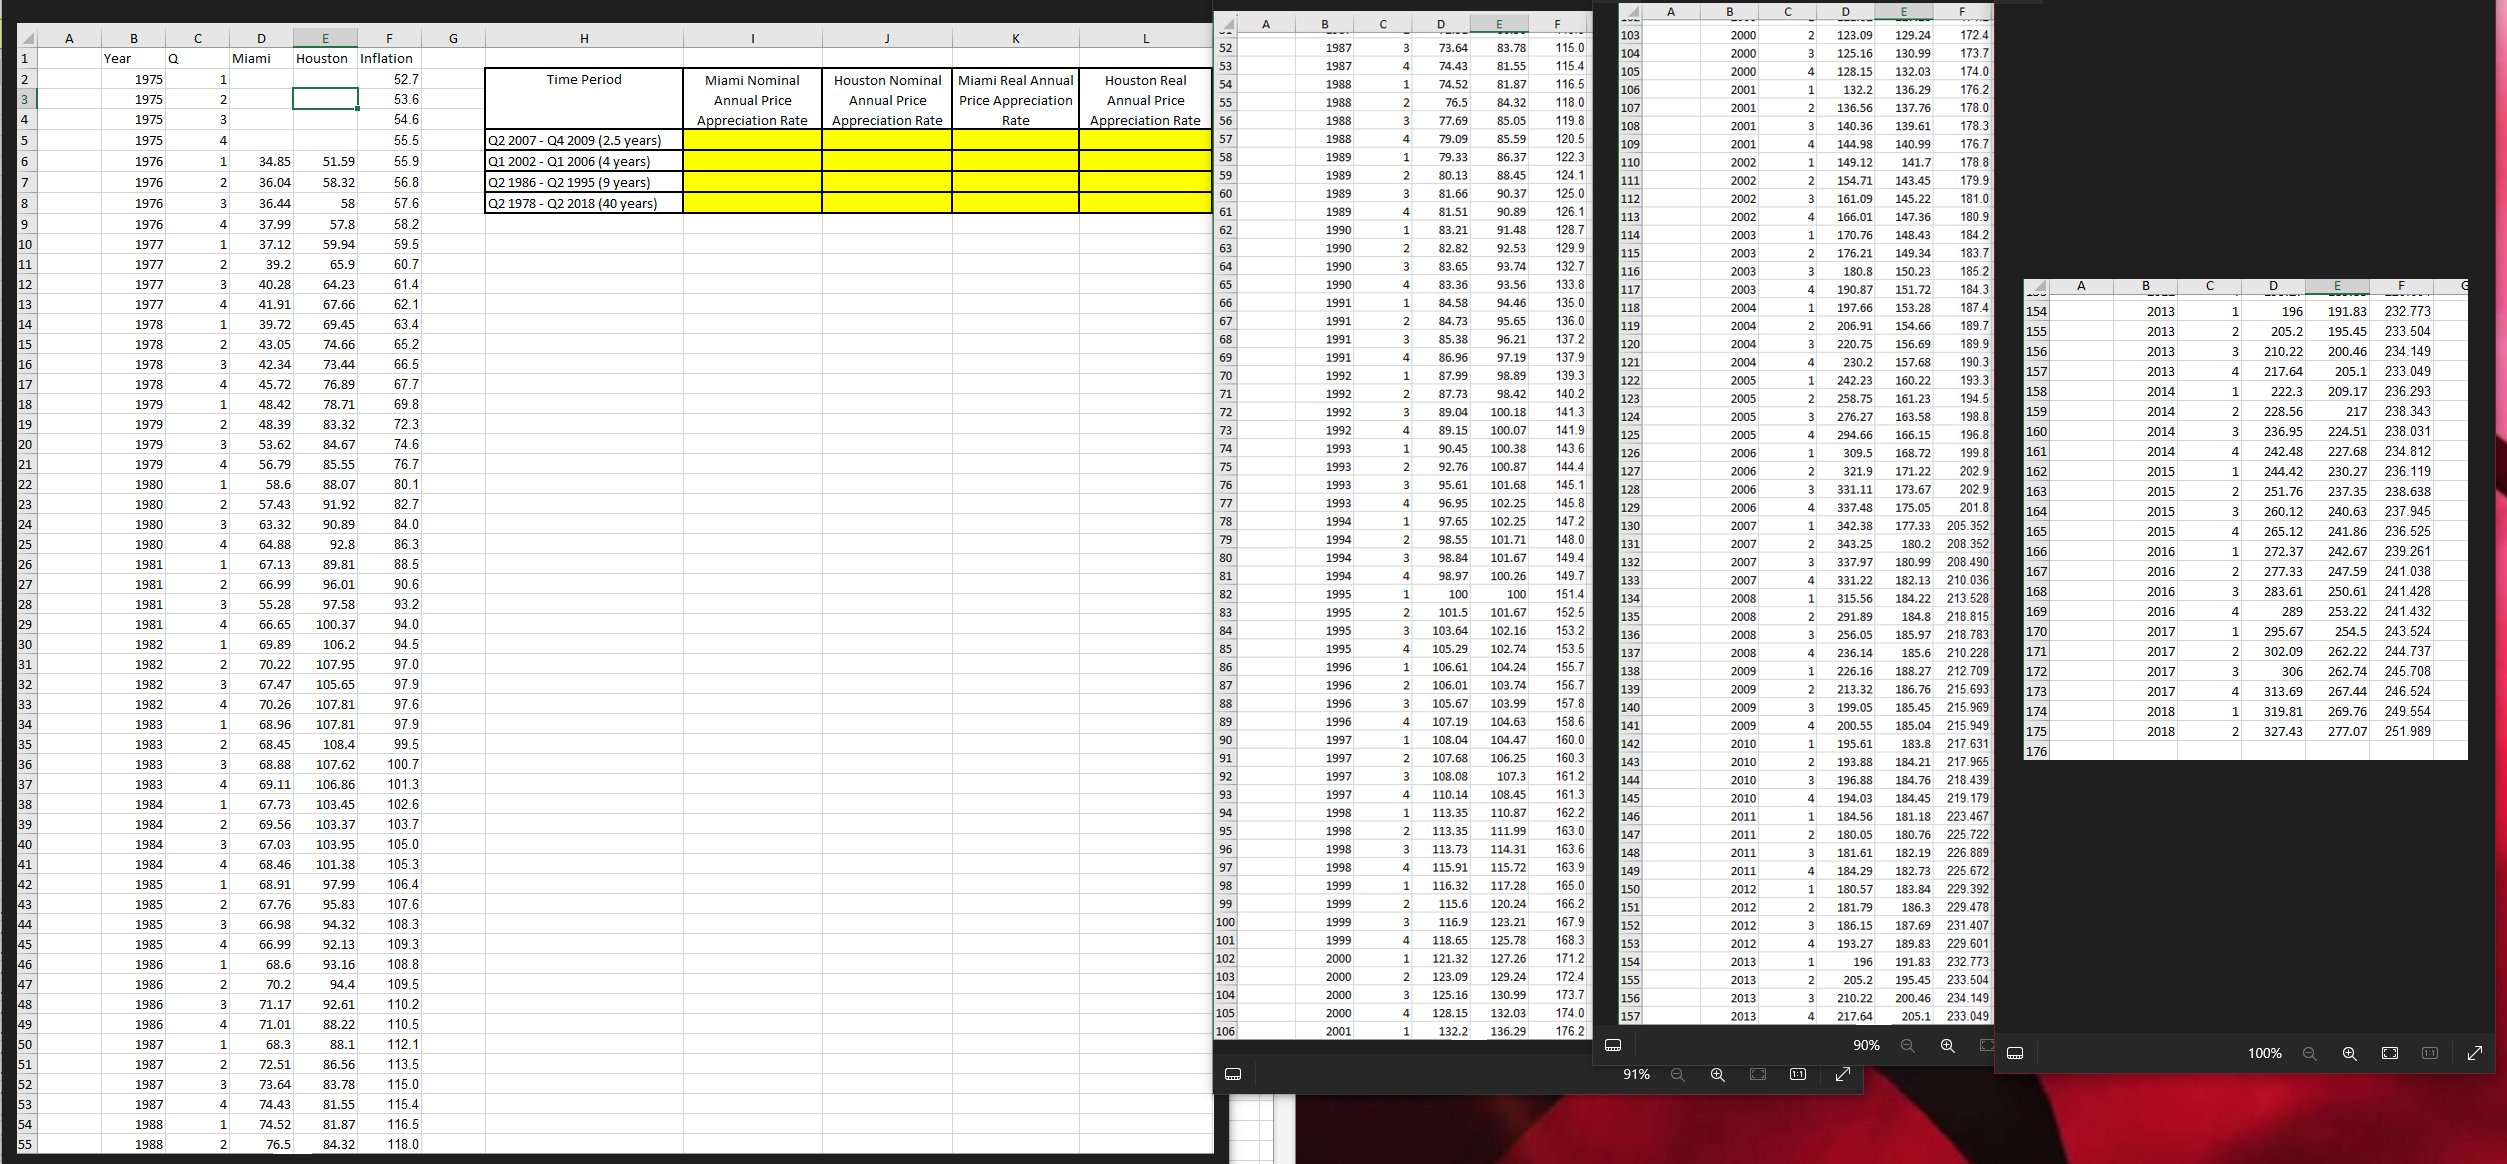
A B D E F 4 A B D 103 2000 2 123.09 129.24 172.4 2 1 A Year B 1975 Q C Miami D F G H 52 1987 3 73.64 83.78 115.0 104 2000 3 125.16 130.99 173.7 Houston Inflation 53 1987 4 74.43 81.55 115.4 105 2000 4 128.15 132.03 174.0 1 52.7 Time Period Miami Nominal 3 1975 2 53.6 4 1975 3 54.6 Annual Price Appreciation Rate Houston Nominal Annual Price Appreciation Rate Miami Real Annual Price Appreciation Rate Houston Real 54 1988 1 74.52 81.87 116.5 106 2001 1 132.2 136.29 176.2 Annual Price 55 1988 2 76.5 84.32 118.0 107 2001 2 136.56 137.76 178.0 Appreciation Rate 56 1988 3 77.69 85.05 119.8 108 2001 3 140.36 139.61 178.3 5 1975 4 55.5 Q2 2007 Q4 2009 (2.5 years) 57 1988 4 79.09 85.59 120.5 109 2001 4 144.98 140.99 176.7 58 1989 1 79.33 86.37 122.3 6 1976 1 34.85 51.59 55.9 Q1 2002-Q1 2006 (4 years) 110 2002 1 149.12 141.7 178.8 59 1989 2 80.13 88.45 124.1 7 1976 2 36.04 58.32 56.8 Q2 1986 Q2 1995 (9 years) 111 2002 2 154.71 143.45 179.9 60 1989 3 81.66 90.37 125.0 112 2002 3 161.09 145.22 181.0 8 1976 3 36.44 58 57.6 Q2 1978 Q2 2018 (40 years) 61 1989 4 81.51 90.89 126.1 113 2002 4 166.01 147.36 180.9 9 1976 4 37.99 57.8 58.2 62 1990 1 83.21 91.48 128.7 114 2003 1 170.76 148.43 184.2 10 1977 1 37.12 59.94 59.5 63 1990 2 82.82 92.53 129.9 115 2003 2 176.21 149.34 183.7 11 1977 2 39.2 65.9 60.7 64 1990 3 83.65 93.74 132.7 116 2003 3 180.8 150.23 185.2 12 1977 3 40.28 64.23 61.4 65 1990 4 83.36 93.56 133.8 117 2003 4 190.87 151.72 184.3 A B C D 13 1977 4 41.91 67.66 62.1 66 1991 1 84.58 94.46 135.0 118 2004 1 197.66 153.28 187.4 154 2013 1 196 191.83 232.773 67 1991 2 84.73 95.65 136.0 14 1978 1 39.72 69.45 63.4 119 2004 2 206.91 154.66 189.7 155 2013 2 205.2 195.45 233.504 68 1991 3 85.38 96.21 137.2 15 1978 2 43.05 120 2004 3 220.75 156.69 189.9 74.66 65.2 156 2013 3 210.22 200.46 234.149 69 1991 4 86.96 97.19 137.9 121 2004 4 230.2 157.68 190.3 16 1978 3 42.34 73.44 66.5 70 1992 1 87.99 98.89 139.3 157 2013 4 217.64 205.1 233.049 122 2005 1 242.23 160.22 193.3 17 1978 4 45.72 76.89 67.7 71 1992 2 87.73 98.42 140.2 158 2014 1 222.3 123 2005 2 258.75 161.23 194.5 18 1979 1 48.42 78.71 69.8 72 1992 3 89.04 100.18 141.3 159 2014 2 228.56 124 2005 3 276.27 163.58 198.8 19 1979 2 48.39 83.32 72.3 73 1992 4 89.15 100.07 141.9 125 2005 20 1979 3 53.62 84.67 74.6 74 1993 1 90.45 100.38 143.6 126 2006 4 1 294.66 166.15 196.8 160 2014 3 309.5 168.72 199.8 161 2014 4 242.48 21 1979 4 56.79 85.55 76.7 75 1993 2 92.76 100.87 144.4 127 2006 2 321.9 171.22 202.9 162 2015 1 22 1980 1 58.6 88.07 80.1 76 1993 3 95.61 101.68 145.1 128 2006 3 331.11 173.67 202.9 163 2015 23 1980 2 57.43 91.92 77 82.7 1993 4 96.95 102.25 145.8 129 2006 4 337.48 175.05 201.8 164 2015 78 1994 1 97.65 102.25 147.2 24 1980 3 63.32 90.89 84.0 130 2007 1 342.38 177.33 205.352 165 2015 4 79 1994 2 98.55 101.71 148.0 25 1980 4 64.88 92.8 86.3 131 2007 2 343.25 180.2 208.352 166 2016 236.293 217 238.343 224.51 236.95 227.68 234.812 244.42 230.27 236.119 2 251.76 237.35 238.638 3 260.12 240.63 237.945 265.12 241.86 236.525 1 272.37 242.67 239.261 209.17 238.031 80 1994 3 98.84 101.67 149.4 132 2007 3 337.97 180.99 208.490 26 1981 1 67.13 89.81 88.5 167 2016 81 1994 4 98.97 100.26 149.7 133 2007 4 331.22 182.13 210.036 27 1981 2 66.99 96.01 90.6 82 1995 1 100 100 151.4 168 2016 2 277.33 3 283.61 247.59 241.038 250.61 241.428 134 2008 1 315.56 28 1981 3 55.28 97.58 93.2 83 1995 2 101.5 101.67 152.5 135 2008 29 1981 4 66.65 100.37 94.0 84 1995 3 103.64 102.16 153.2 136 2008 2 291.89 3 256.05 30 1982 1 69.89 106.2 94.5 85 1995 4 105.29 102.74 153.5 137 2008 4 236.14 31 1982 2 70.22 107.95 97.0 86 1996 1 106.61 104.24 155.7 138 2009 1 226.16 32 1982 3 67.47 105.65 97.9 87 1996 2 106.01 103.74 156.7 139 2009 2 213.32 33 1982 4 70.26 107.81 97.6 88 1996 3 105.67 103.99 157.8 140 2009 3 199.05 184.22 213.528 218.815 184.8 218.783 185.97 185.6 210.228 188.27 212.709 186.76 215.693 185.45 215.969 169 170 171 172 2016 4 289 253.22 241.432 2017 1 295.67 254.5 243.524 2017 173 2017 2017 2 3 302.09 262.22 244.737 306 4 313.69 262.74 245.708 267.44 246.524 174 2018 1 319.81 269.76 249.554 89 1996 4 107.19 104.63 158.6 34 1983 1 68.96 107.81 97.9 141 2009 90 1997 1 108.04 104.47 160.0 142 2010 4 200.55 185.04 215.949 1 195.61 183.8 217.631 35 1983 2 68.45 108.4 99.5 175 176 2018 2 327.43 277.07 251.989 91 1997 2 107.68 106.25 160.3 143 2010 2 193.88 184.21 217.965 36 1983 3 68.88 107.62 100.7 92 1997 3 108.08 107.3 161.2 144 2010 3 37 1983 4 69.11 106.86 101.3 93 1997 4 110.14 108.45 161.3 145 2010 38 1984 1 67.73 103.45 102.6 94 1998 1 113.35 110.87 162.2 146 2011 39 1984 2 69.56 103.37 103.7 95 1998 2 113.35 111.99 163.0 147 2011 40 1984 3 67.03 103.95 105.0 96 1998 3 113.73 114.31 163.6 148 2011 3 41 1984 4 68.46 101.38 105.3 97 1998 4 115.91 115.72 163.9 149 2011 42 1985 1 68.91 97.99 106.4 98 1999 1 116.32 117.28 165.0 150 2012 43 1985 2 67.76 95.83 107.6 99 1999 2 115.6 120.24 166.2 151 2012 100 1999 3 116.9 123.21 167.9 44 1985 3 66.98 94.32 108.3 152 2012 196.88 184.76 218.439 4 194.03 184.45 219.179 1 184.56 181.18 223.467 2 180.05 181.61 182.19 226.889 4 184.29 182.73 225.672 1 180.57 183.84 229.392 186.3 229.478 2 181.79 3 186.15 187.69 231.407 180.76 225.722 101 1999 4 118.65 125.78 168.3 45 1985 4 66.99 153 2012 4 193.27 189.83 229.601 92.13 109.3 102 2000 1 121.32 127.26 171.2 154 2013 1 196 191.83 232.773 46 1986 1 68.6 93.16 108.8 103 2000 2 123.09 129.24 172.4 155 2013 2 47 1986 2 70.2 94.4 109.5 104 2000 3 125.16 130.99 173.7 156 2013 3 48 1986 3 71.17 92.61 110.2 105 2000 4 128.15 132.03 174.0 157 2013 49 1986 4 71.01 88.22 110.5 106 2001 1 132.2 136.29 176.2 50 1987 1 68.3 88.1 112.1 O 205.2 195.45 233.504 210.22 200.46 234.149 4 217.64 90% Q 205.1 233.049 100% + 1:1 51 1987 2 72.51 86.56 113.5 91% Q + [1:1] 52 1987 3 73.64 83.78 115.0 53 1987 4 74.43 81.55 115.4 54 1988 1 74.52 81.87 116.5 55 1988 2 76.5 84.32 118.0
Step by Step Solution
There are 3 Steps involved in it
Step: 1

Get Instant Access to Expert-Tailored Solutions
See step-by-step solutions with expert insights and AI powered tools for academic success
Step: 2

Step: 3
Ace Your Homework with AI
Get the answers you need in no time with our AI-driven, step-by-step assistance
Get Started
The Economics Of Money Banking And Financial Markets
Authors: Frederic S. Mishkin, Apostolos Serletis
4th Canadian Edition
0321584716, 978-0321584717