Calculate the NPV and IRR for each of the following worksheets. Thank you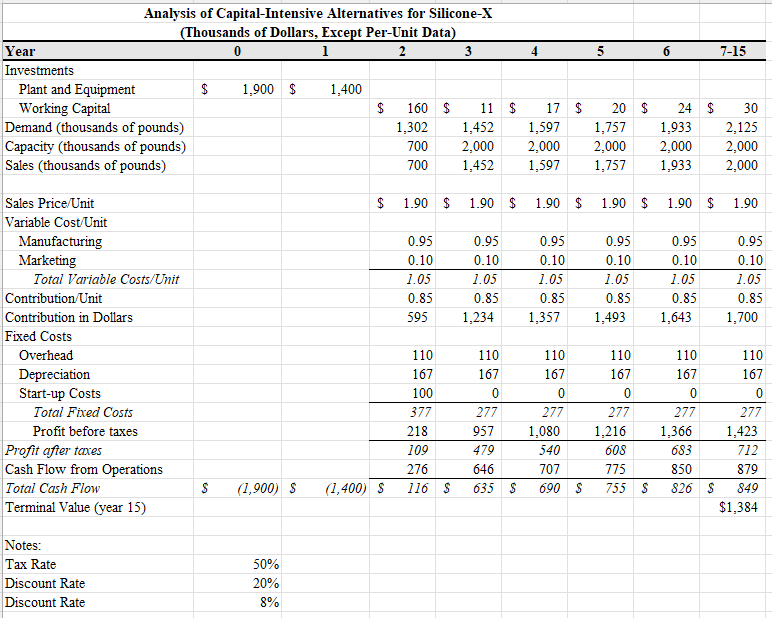
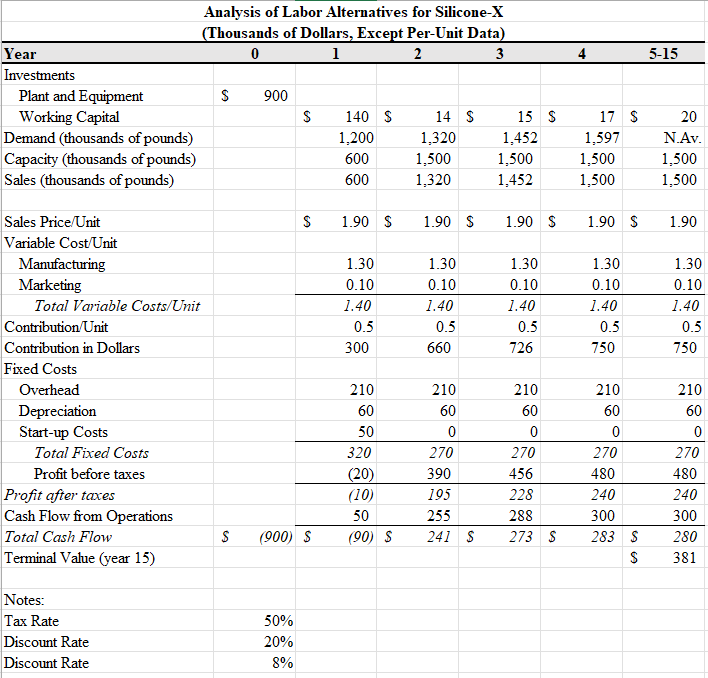
4 6 7-15 Analysis of Capital-Intensive Alternatives for Silicone-X (Thousands of Dollars, Except Per-Unit Data) Year 0 1 2 3 Investments Plant and Equipment $ 1,900 $ 1,400 Working Capital $ 160 $ 11 $ Demand (thousands of pounds) 1,302 1,452 Capacity (thousands of pounds) 700 2,000 Sales (thousands of pounds) 700 1,452 17 $ 1,597 2,000 1,597 20 $ 1,757 2,000 1,757 24 $ 1,933 2,000 1,933 30 2,125 2,000 2,000 $ 1.90 $ 1.90 $ 1.90 $ 1.90 $ 1.90 $ 1.90 0.95 0.10 1.05 0.85 595 0.95 0.10 1.05 0.85 1,234 0.95 0.10 1.05 0.85 1,357 0.95 0.10 1.05 0.85 1,493 0.95 0.10 1.05 0.85 1.643 0.95 0.10 1.05 0.85 1,700 Sales Price Unit Variable Cost/Unit Manufacturing Marketing Total Variable Costs/Unit Contribution Unit Contribution in Dollars Fixed Costs Overhead Depreciation Start-up Costs Total Fixed Costs Profit before taxes Profit after taxes Cash Flow from Operations Total Cash Flow Terminal Value (year 15) 110 167 100 377 218 109 276 116 $ 110 167 0 277 957 479 646 635 $ 110 167 0 277 1,080 540 707 690 $ 110 167 0 277 1,216 608 775 755 $ 110 110 167 167 0 0 277 277 1,366 1,423 683 712 850 879 826 S 849 $1,384 $ (1,900) S (1,400 $ Notes: Tax Rate Discount Rate Discount Rate 50% 20% 8% 4 5-15 Analysis of Labor Alternatives for Silicone-X (Thousands of Dollars, Except Per-Unit Data) Year 0 1 2 3 Investments Plant and Equipment S 900 Working Capital $ 140 S 14 S 15 $ Demand (thousands of pounds) 1,200 1,320 1,452 Capacity (thousands of pounds) 600 1,500 1,500 Sales (thousands of pounds) 600 1,320 1.452 17 S 1,597 1,500 1,500 20 N.Av. 1,500 1,500 $ 1.90 S 1.90 $ 1.90 S 1.90 $ 1.90 1.30 0.10 1.40 0.5 300 1.30 0.10 1.40 0.5 660 1.30 0.10 1.40 1.30 0.10 1.40 0.5 750 1.30 0.10 1.40 0.5 750 0.5 726 Sales Price Unit Variable Cost/Unit Manufacturing Marketing Total Variable Costs/Unit Contribution/Unit Contribution in Dollars Fixed Costs Overhead Depreciation Start-up Costs Total Fixed Costs Profit before taxes Profit after taxes Cash Flow from Operations Total Cash Flow Terminal Value (year 15) 210 60 50 320 (20) (10) 50 (90) S 210 60 0 270 390 195 255 241 $ 210 60 0 270 456 228 288 273 S 210 60 0 270 480 240 300 283 $ S 210 60 0 270 480 240 300 280 381 S (900) S Notes: Tax Rate Discount Rate Discount Rate 50% 20% 8% 4 6 7-15 Analysis of Capital-Intensive Alternatives for Silicone-X (Thousands of Dollars, Except Per-Unit Data) Year 0 1 2 3 Investments Plant and Equipment $ 1,900 $ 1,400 Working Capital $ 160 $ 11 $ Demand (thousands of pounds) 1,302 1,452 Capacity (thousands of pounds) 700 2,000 Sales (thousands of pounds) 700 1,452 17 $ 1,597 2,000 1,597 20 $ 1,757 2,000 1,757 24 $ 1,933 2,000 1,933 30 2,125 2,000 2,000 $ 1.90 $ 1.90 $ 1.90 $ 1.90 $ 1.90 $ 1.90 0.95 0.10 1.05 0.85 595 0.95 0.10 1.05 0.85 1,234 0.95 0.10 1.05 0.85 1,357 0.95 0.10 1.05 0.85 1,493 0.95 0.10 1.05 0.85 1.643 0.95 0.10 1.05 0.85 1,700 Sales Price Unit Variable Cost/Unit Manufacturing Marketing Total Variable Costs/Unit Contribution Unit Contribution in Dollars Fixed Costs Overhead Depreciation Start-up Costs Total Fixed Costs Profit before taxes Profit after taxes Cash Flow from Operations Total Cash Flow Terminal Value (year 15) 110 167 100 377 218 109 276 116 $ 110 167 0 277 957 479 646 635 $ 110 167 0 277 1,080 540 707 690 $ 110 167 0 277 1,216 608 775 755 $ 110 110 167 167 0 0 277 277 1,366 1,423 683 712 850 879 826 S 849 $1,384 $ (1,900) S (1,400 $ Notes: Tax Rate Discount Rate Discount Rate 50% 20% 8% 4 5-15 Analysis of Labor Alternatives for Silicone-X (Thousands of Dollars, Except Per-Unit Data) Year 0 1 2 3 Investments Plant and Equipment S 900 Working Capital $ 140 S 14 S 15 $ Demand (thousands of pounds) 1,200 1,320 1,452 Capacity (thousands of pounds) 600 1,500 1,500 Sales (thousands of pounds) 600 1,320 1.452 17 S 1,597 1,500 1,500 20 N.Av. 1,500 1,500 $ 1.90 S 1.90 $ 1.90 S 1.90 $ 1.90 1.30 0.10 1.40 0.5 300 1.30 0.10 1.40 0.5 660 1.30 0.10 1.40 1.30 0.10 1.40 0.5 750 1.30 0.10 1.40 0.5 750 0.5 726 Sales Price Unit Variable Cost/Unit Manufacturing Marketing Total Variable Costs/Unit Contribution/Unit Contribution in Dollars Fixed Costs Overhead Depreciation Start-up Costs Total Fixed Costs Profit before taxes Profit after taxes Cash Flow from Operations Total Cash Flow Terminal Value (year 15) 210 60 50 320 (20) (10) 50 (90) S 210 60 0 270 390 195 255 241 $ 210 60 0 270 456 228 288 273 S 210 60 0 270 480 240 300 283 $ S 210 60 0 270 480 240 300 280 381 S (900) S Notes: Tax Rate Discount Rate Discount Rate 50% 20% 8%