Answered step by step
Verified Expert Solution
Question
1 Approved Answer
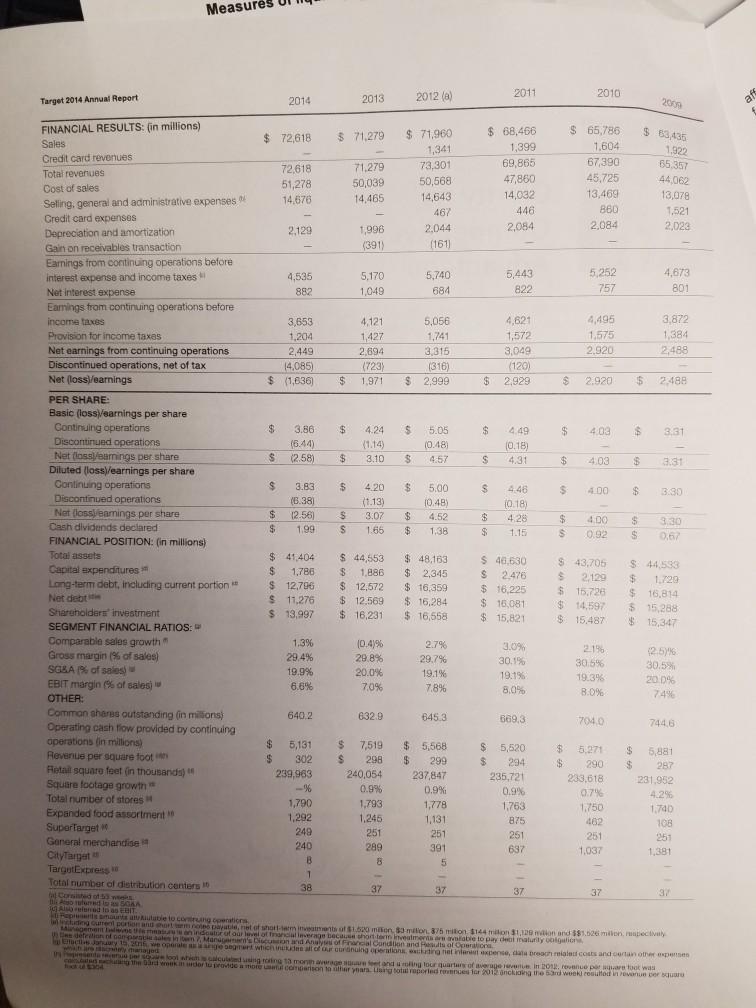
Section 4-Budgeting (25 points) 1. Calculate the percentage change for each of the following categories of revenues and expenses for FY 2010 through FY


Section 4-Budgeting (25 points) 1. Calculate the percentage change for each of the following categories of revenues and expenses for FY 2010 through FY 2014. 2. Calculate the average percentage change 3. Use the FY 2014 data and the average percentage change calculated in 2 to prepare a budget for FY 2015 4. Compare actual amounts from FY 2015 to the budget Target 2014 Annual Report FINANCIAL RESULTS: (in millions) Sales Credit card revenues Total revenues Cost of sales Selling, general and administrative expenses Credit card expenses Depreciation and amortization Gain on receivables transaction Measures Earnings from continuing operations before interest expense and income taxes Net interest expense Earnings from continuing operations before income taxes Provision for income taxes Net earnings from continuing operations Discontinued operations, net of tax Net (loss)/earnings PER SHARE: Basic (loss)/earnings per share Continuing operations Discontinued operations Net (loss/earings per share Diluted (loss)/earnings per share Continuing operations Discontinued operations Net (loss/earnings per share Cash dividends declared FINANCIAL POSITION: (in millions) Total assets Capital expenditures Long-term debt, including current portion ** Net debt Shareholders investment SEGMENT FINANCIAL RATIOS: Comparable sales growth" Gross margin (% of sales) SG&A (% of sales) EBIT margin (% of sales) OTHER: Common shares outstanding (in millions) Operating cash flow provided by continuing operations (in millions) Revenue per square foot Retail square feet (in thousands) Square footage growth" Total number of stores Expanded food assortment SuperTarget General merchandise CityTarget TargetExpress Total number of distribution centers 10 al Consisted of 53 Ao ruferred to as SGAA Also referred to as EBIT $72,618 $ 2014 $ 3,653 1,204 2,449 (4,085) $ (1,636) $ $ 72,618 51,278 14.676 3.86 (6.44) $ (2.58) 2,129 4,535 882 $ $ 3.83 (6.38) (2.56) 1.99 $ 41,404 $ 1,786 $ 12,796 $ 11,276 $ 13,997 1.3% 29.4% 19.9% 6.6% 640.2 5,131 302 239,963 -% 1,790 1,292 249 240 B 1 38 $ 71,279 $ $ $ $ (723) $ 1,971 $ 2013 $ 71,279 50,039 14,465 1,996 (391) $ 5,170 1,049 $ 4,121 1,427 2.694 *** **** ! ********** 4.24 (1.14) 3.10 4.20 (1.13) $ 44,553 3.07 1.66 $ 12,572 1,886 $12.569 $16.231 (0.4)% 29.8% 20.0% 7,0% 632.9 7,519 298 240,054 0.9% 1,793 1.246 251 289 8 37 $71,960 1,341 73,301 50,568 14,643 467 2,044 (161) $ $ (316) $ 2,999 $ 2012 (8) $ $ 5,740 684 5,056 1,741 3,315 5.05 (0.48) 4.57 5.00 (0.48) 4.52 1.38 $ 48,163 $ 2,345 $ 16,359 $ 16,284 $16.558 2.7% 29.7% 19.1% 7.8% 645.3 $ 5.568 $299 237,847 0.9 % 1,778 1,1311 251 391 5 37 $68,466 1,399 69,865 47,860 $ $ $ 69 69 6 $ 2011 $ 14,032 446 2,084 5,443 822 4,621 1,572 3,049 (120) 2,929 4.49 (0.18) 4.31 4.46 (0.18) 4.28 1.15 $ 40.630 $ 2,476 $ 16,225 $ 16,081 $15,821 3.0% 30.1% 19.1% 8.0% 669,3 $ 5,520 $ 294 235,721 0.9% 1,763 875 251 637 137 $ $ $ $ $ $ 2010 $ 65,786 1,604 67,390 45,725 13,469 860 2,084 ** $55' 3' 3'58 (0) 454 2 5****** $ 43,705 $ $15.726 $14,597 $15.487 $ 5,271 $ 2009 69 69 69 $ 63,435 1.922 65.357 $ 44,062 13,078 1,521 2,023 $ 2,488 $ 4,673 801 $ 3.31 3,872 1,384 2,488 $ 3.31 $ 3:30 3.30 0.67 $ 44,533 $ 1,729 $ 16,814 $ 15,288 $15,347 (2.5) % 30.5% 20.0% 74% 744.6 $ 5,881 $ 287 231,952 4.2% 1,740 108 251 1,381 37 Represents amounts at Autable to contrung operations including current portion and short sem notes payable, het of short-term investments of $1.520 million, $3 milion, 875 milion $144 milion $1,129 maion and $$1.526 million, mapectively Management believes the meas Des defeation an indeator of our level of financial leverage because short-term inveatments are available to pay dent maturity ooigations ales ben 7, Analyses of Financial of Efacties January 12, 2tre and what managed are a stris, we operate as aange segment which includes all of our curdnuing operations, exciting niet inferust expense, data breach reialed costs and certain other expenses sacenua per sour lool which coase machung week fou $304 calculated using roring 13 month average square feet and a roing tour quarters of average revenue in 2012, revenue par square foot was ng the Garderouk in order to provide a more uatul comparison to siffer years. Using total reported revenues for 2012 including the 53rd week) resulted in revenue per square
Step by Step Solution
★★★★★
3.52 Rating (155 Votes )
There are 3 Steps involved in it
Step: 1
Question 1 Percentange change of Revenuer between FY 2010 and FY 2014 ...
Get Instant Access to Expert-Tailored Solutions
See step-by-step solutions with expert insights and AI powered tools for academic success
Step: 2

Step: 3

Document Format ( 2 attachments)
635deeed7c0fc_180095.pdf
180 KBs PDF File
635deeed7c0fc_180095.docx
120 KBs Word File
Ace Your Homework with AI
Get the answers you need in no time with our AI-driven, step-by-step assistance
Get Started


