Answered step by step
Verified Expert Solution
Question
1 Approved Answer
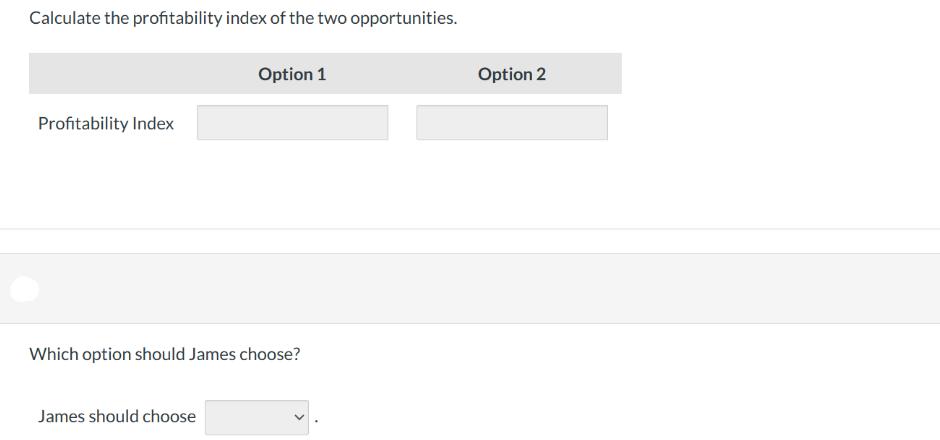
Calculate the profitability index of the two opportunities. Option 1 Profitability Index Which option should James choose? James should choose Option 2 APPENDIX 9.1


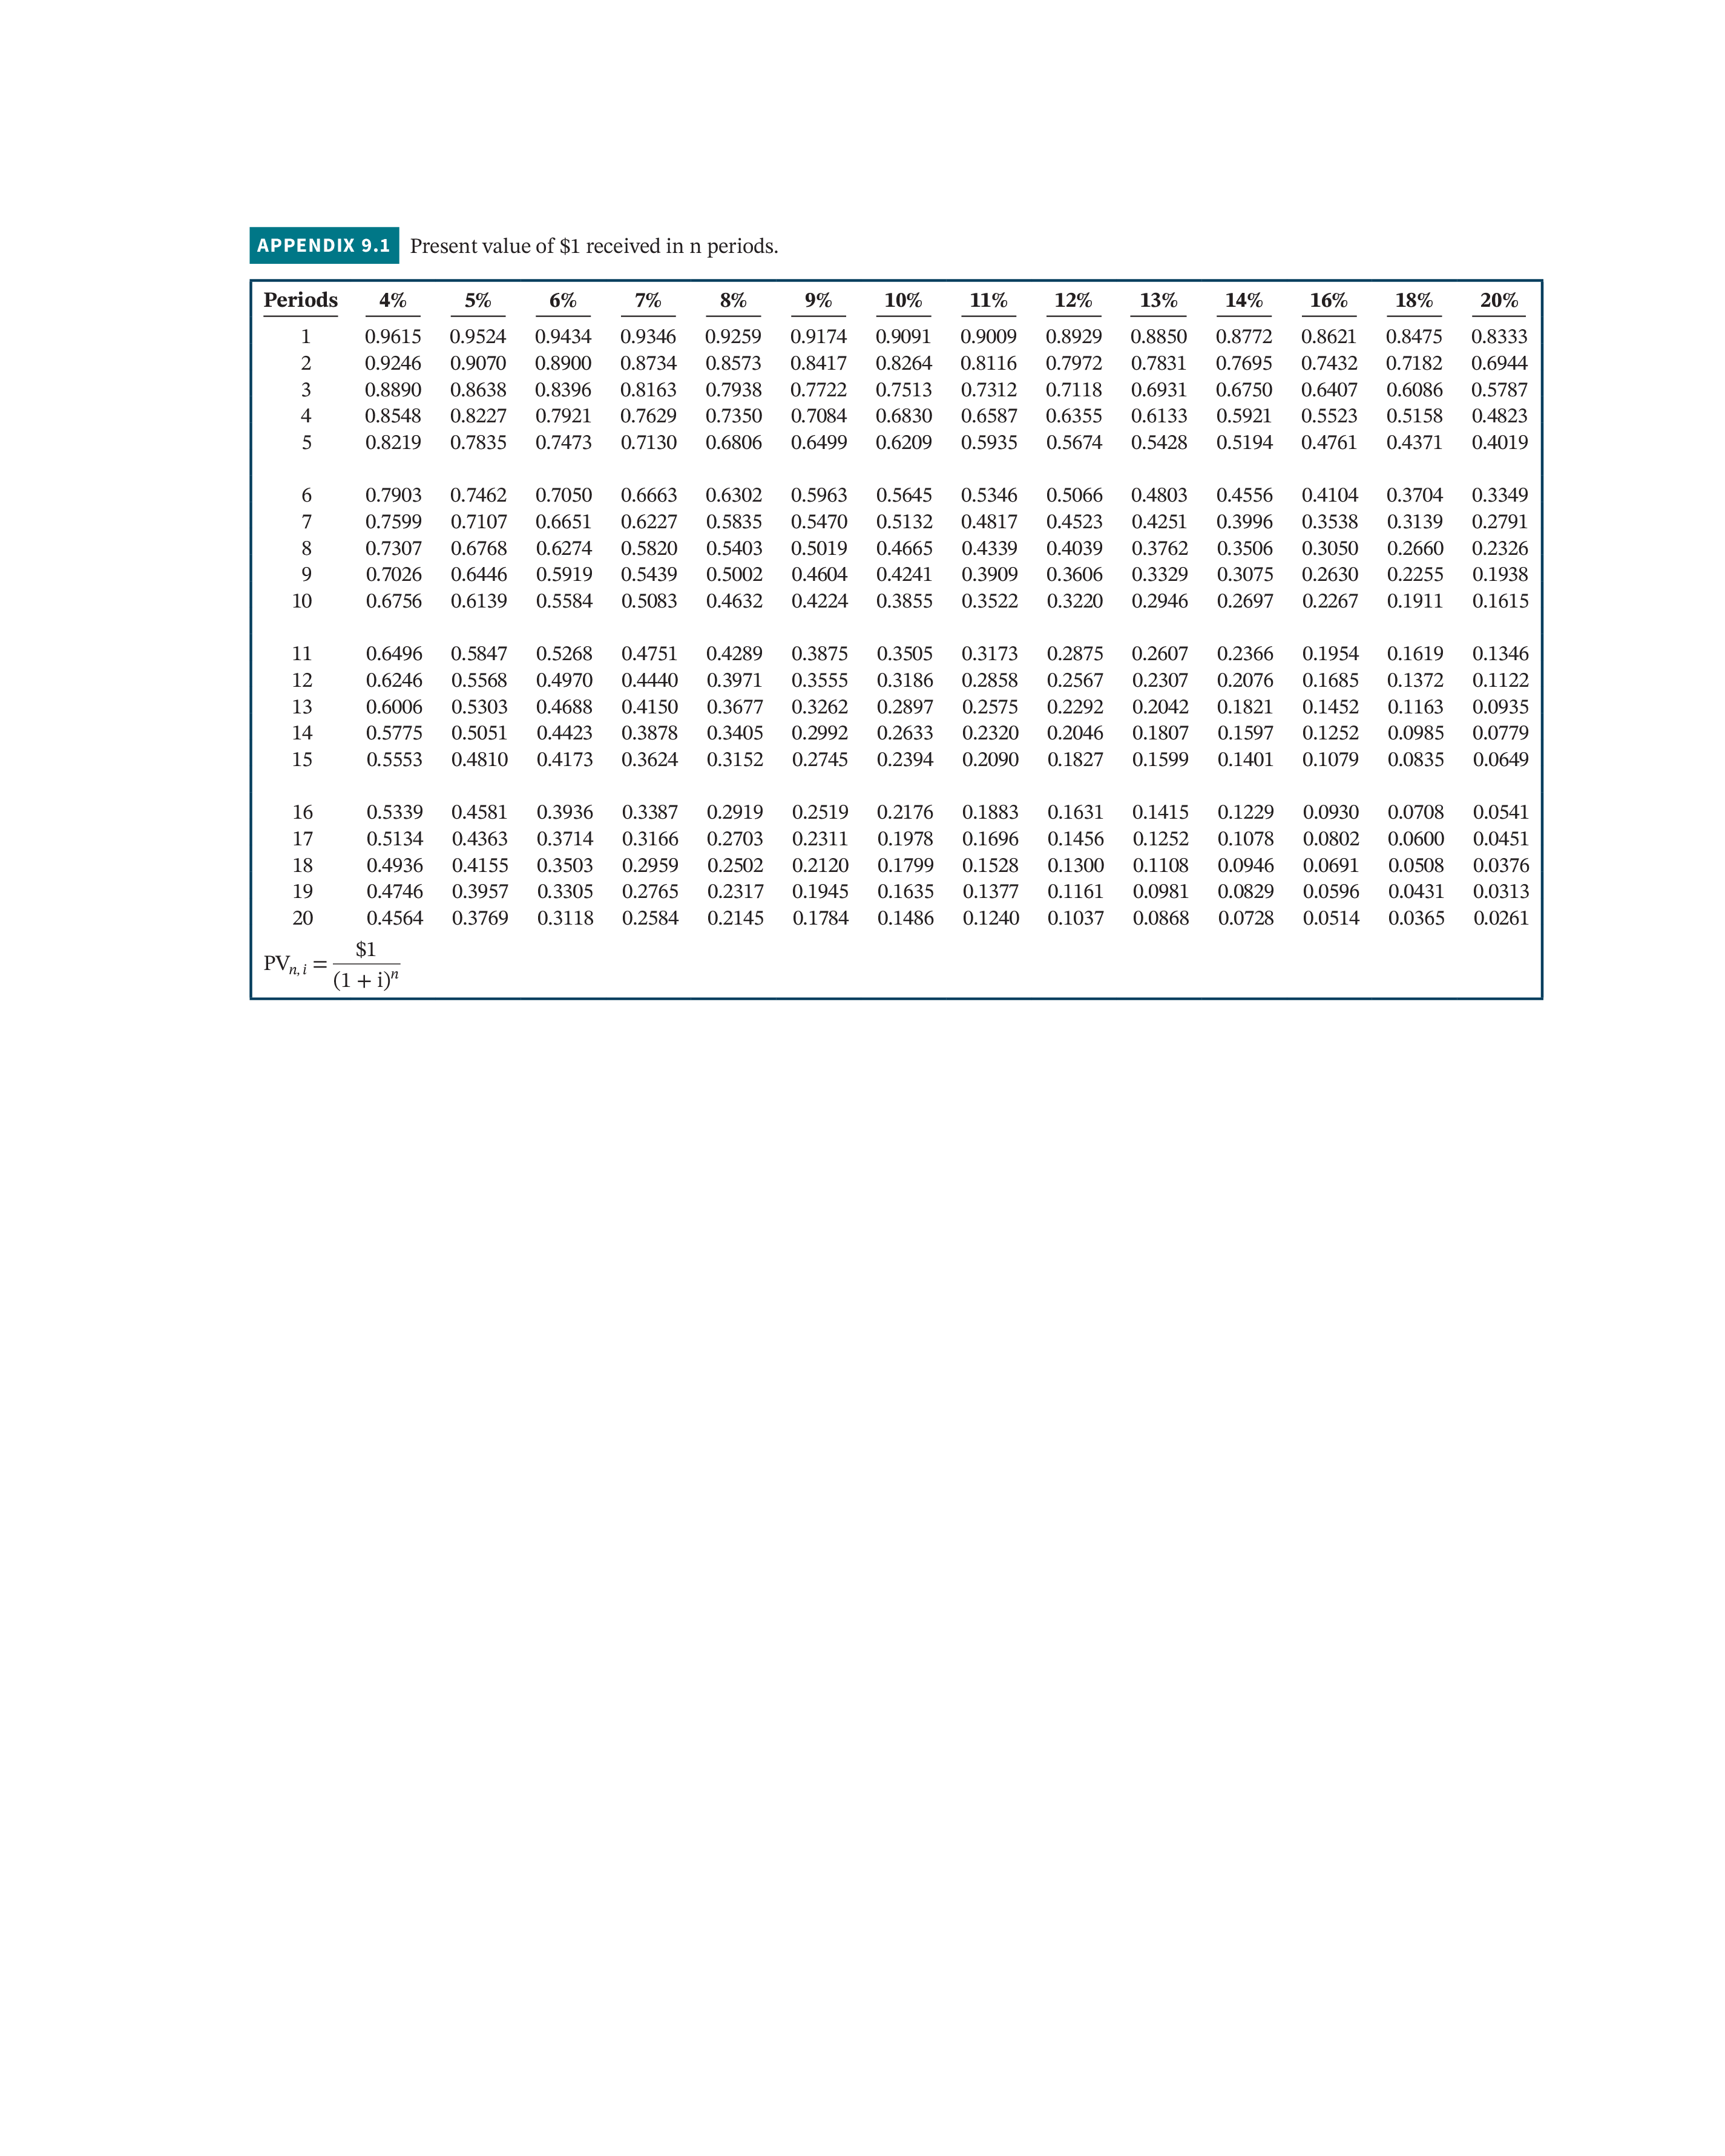
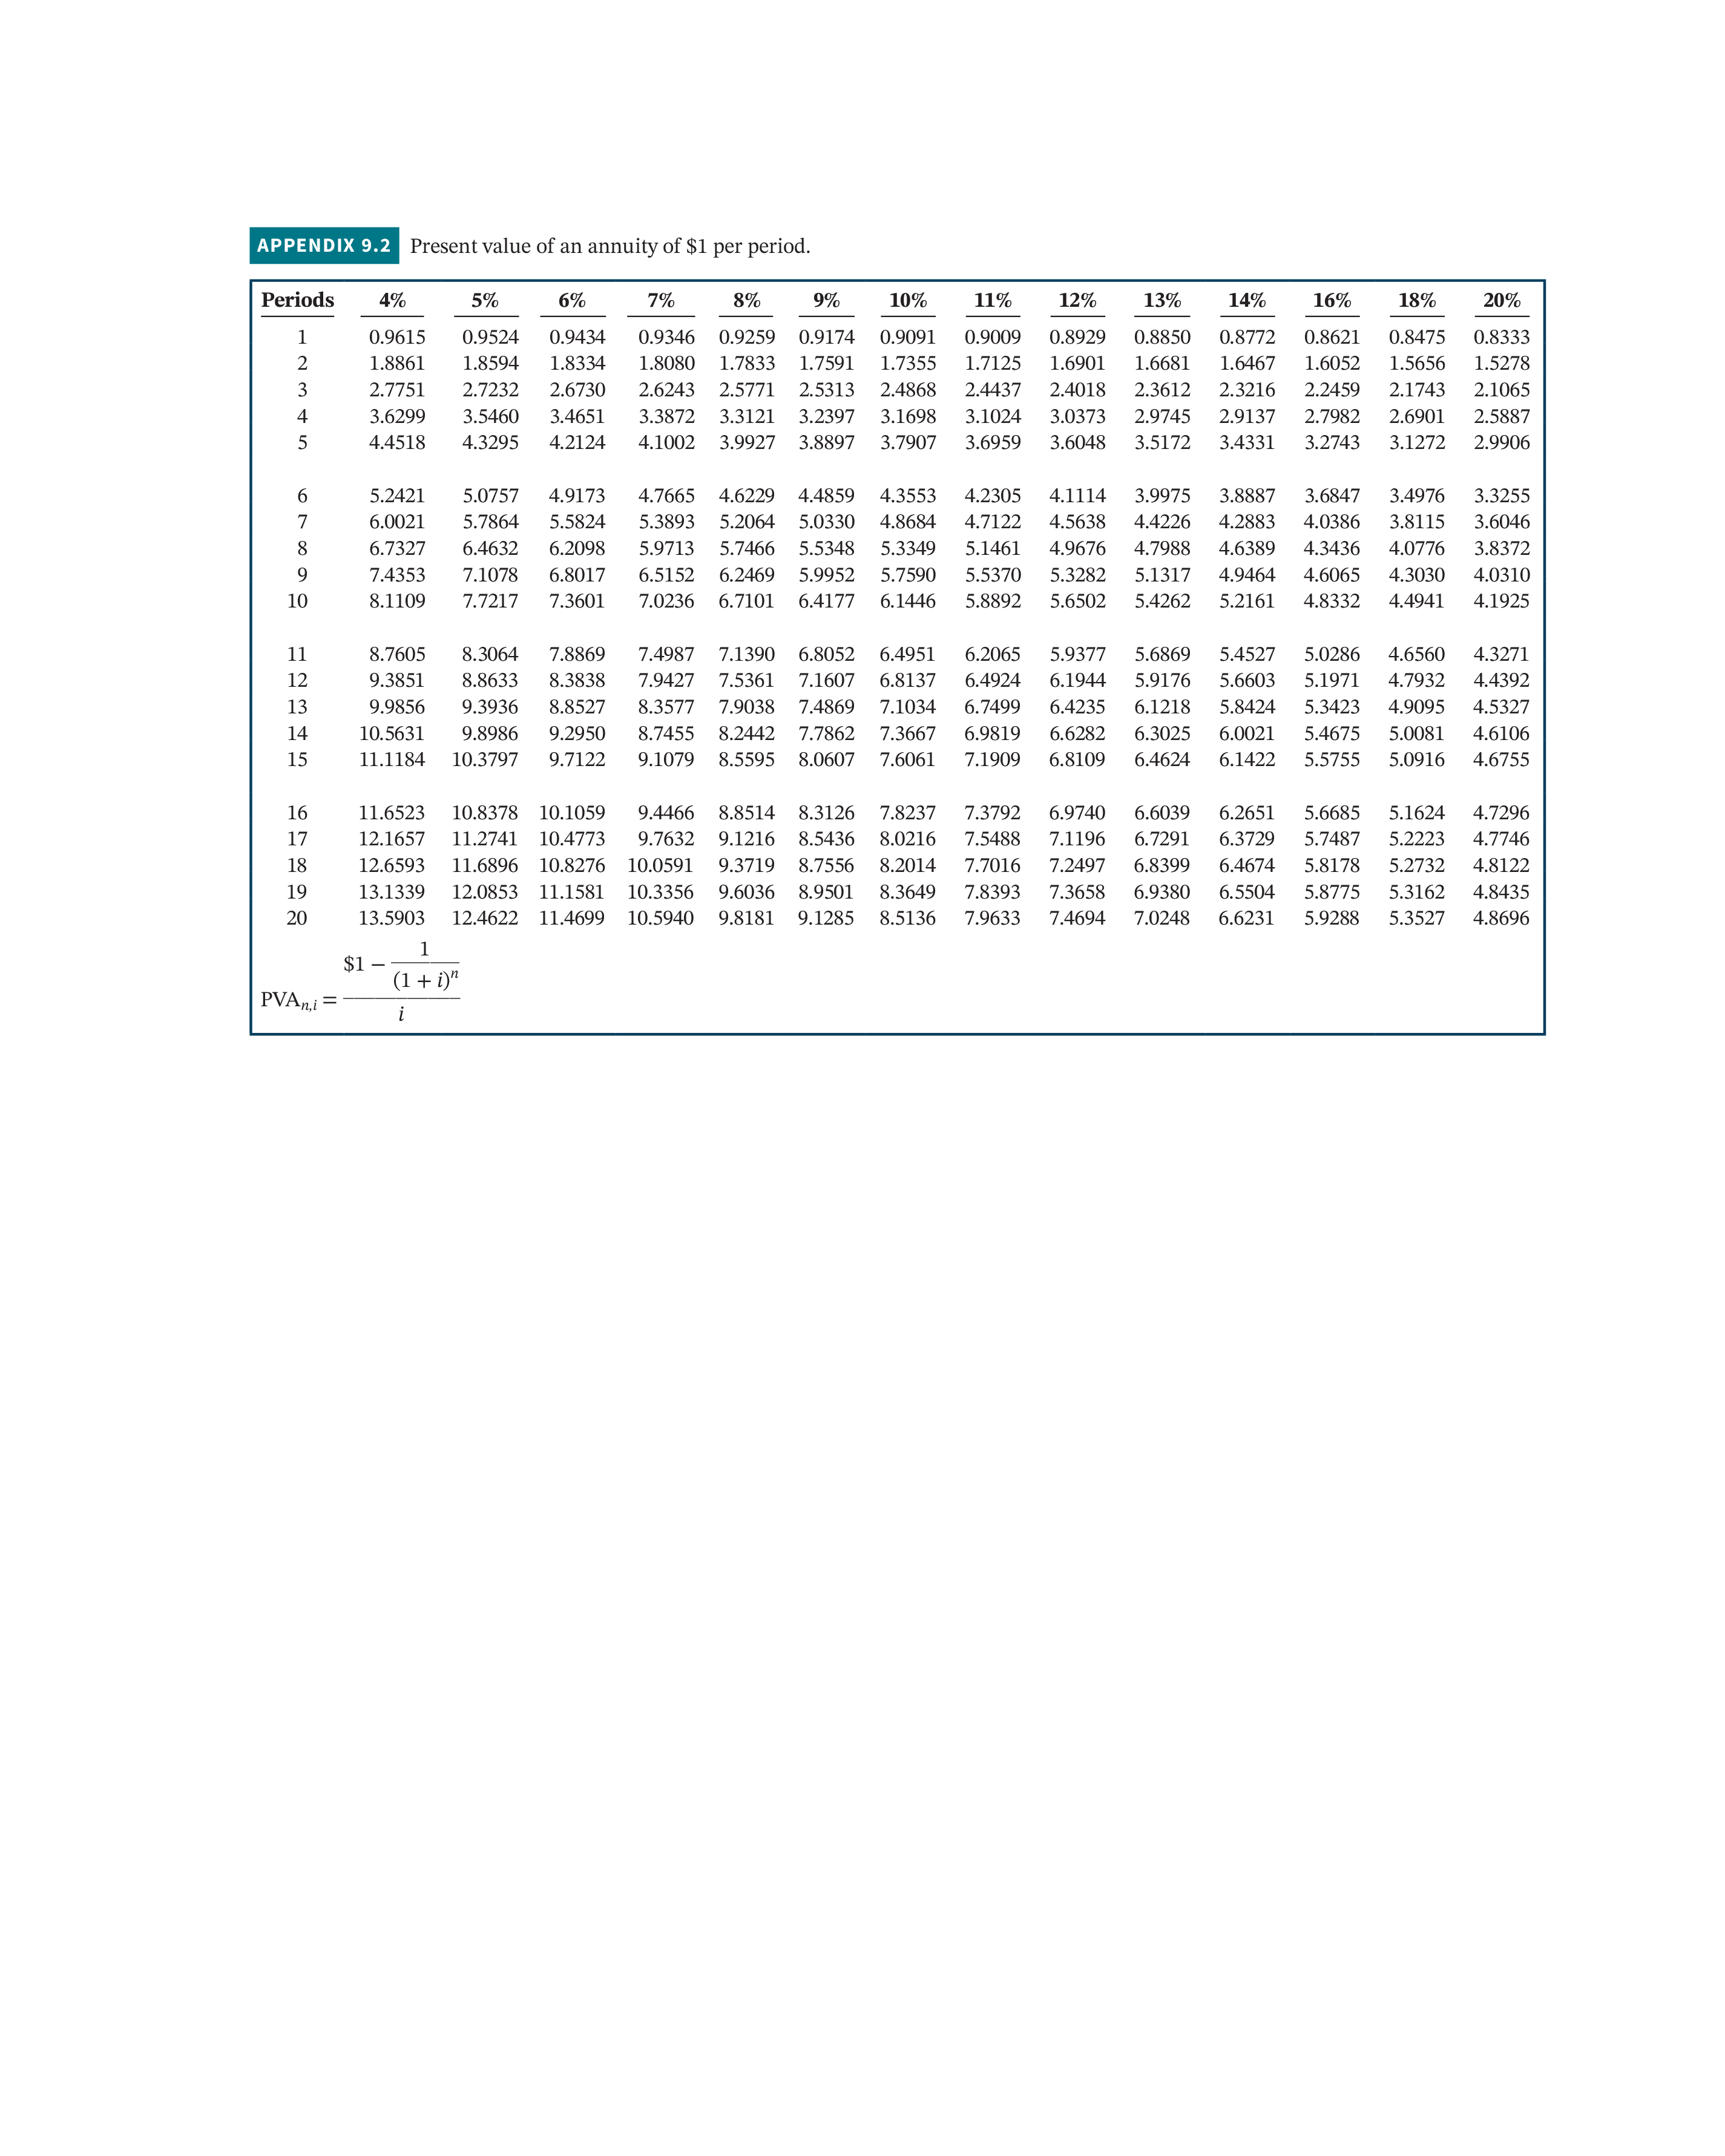
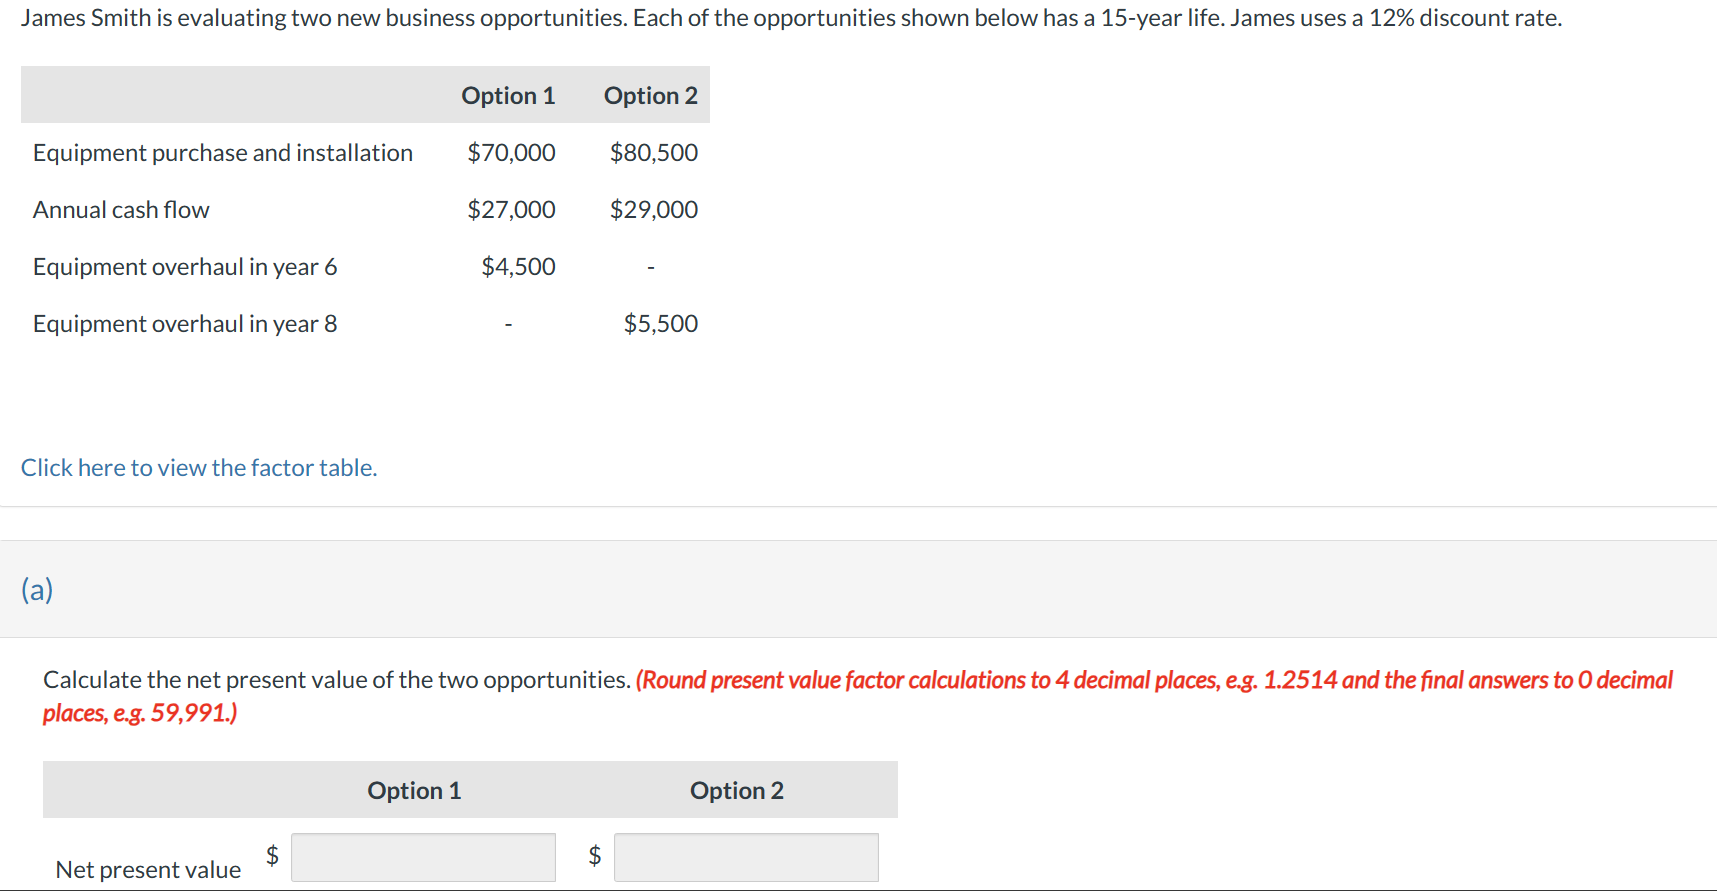
Calculate the profitability index of the two opportunities. Option 1 Profitability Index Which option should James choose? James should choose Option 2 APPENDIX 9.1 Present value of $1 received in n periods. Periods 4% 5% 6% 1 2 3 45 6782 7% 8% 9% 10% 0.9615 0.9524 0.9434 0.9346 0.9259 0.9174 0.9091 0.9009 0.8929 0.8850 0.8772 0.8621 0.9246 0.9070 0.8900 0.8734 0.8573 0.8417 0.8264 0.8116 0.7972 0.7831 0.7695 0.7432 0.7182 0.8890 0.8638 0.8396 0.8163 0.7938 0.7722 0.7513 0.7312 0.7118 0.6931 0.6750 0.6407 0.6086 0.5787 0.8548 0.8227 0.7921 0.7629 0.7350 0.7084 0.6830 0.6587 0.6355 0.6133 0.5921 0.5523 0.5158 0.4823 0.8219 0.7835 0.7473 0.7130 0.6806 0.6499 0.6209 0.5935 0.5674 0.5428 0.5194 0.4761 0.4371 0.4019 11% 12% 13% 14% 16% 18% 20% 0.8475 0.8333 0.6944 9 0.7026 0.6446 10 0.6756 0.6139 0.7903 0.7462 0.7050 0.7599 0.7107 0.6651 0.7307 0.6768 0.6274 0.5919 0.5584 0.6663 0.6302 0.5963 0.6227 0.5835 0.5470 0.5820 0.5403 0.5019 0.5439 0.5002 0.4604 0.5083 0.4632 0.4224 0.3522 0.3220 0.2946 0.2697 0.5645 0.5346 0.5066 0.4803 0.4556 0.4104 0.3704 0.3349 0.5132 0.4817 0.4523 0.4251 0.3996 0.3538 0.3139 0.2791 0.4665 0.4339 0.4039 0.3762 0.3506 0.3050 0.2660 0.2326 0.4241 0.3909 0.3606 0.3329 0.3075 0.2630 0.2255 0.1938 0.3855 0.2267 0.1911 0.1615 11 12 13 14 15 0.6496 0.5847 0.5268 0.4751 0.4289 0.3875 0.3505 0.3173 0.2875 0.2607 0.2366 0.1954 0.1619 0.1346 0.6246 0.5568 0.4970 0.4440 0.3971 0.3555 0.3186 0.2858 0.2567 0.2307 0.2076 0.1685 0.1372 0.1122 0.6006 0.5303 0.4688 0.4150 0.3677 0.3262 0.2897 0.2575 0.2292 0.2042 0.1821 0.1452 0.1163 0.0935 0.5775 0.5051 0.4423 0.3878 0.3405 0.2992 0.2633 0.2320 0.2046 0.1807 0.1597 0.1252 0.0985 0.0779 0.5553 0.4810 0.4173 0.3624 0.3152 0.2745 0.2394 0.2090 0.1827 0.1599 0.1401 0.1079 0.0835 0.0649 16 17 18 19 20 0.5339 0.4581 0.3936 0.3387 0.2919 0.2519 0.2176 0.1883 0.1631 0.1415 0.5134 0.4363 0.3714 0.3166 0.2703 0.2311 0.1978 0.1696 0.1456 0.1252 0.4936 0.4155 0.3503 0.2959 0.2502 0.2120 0.1799 0.1528 0.1300 0.4746 0.3957 0.3305 0.2765 0.2317 0.1945 0.1635 0.1377 0.1161 0.4564 0.3769 0.3118 0.2584 0.2145 0.1784 0.1486 0.1240 0.1037 0.1108 0.0981 0.0868 0.1229 0.0930 0.1078 0.0802 0.0946 0.0691 0.0829 0.0596 0.0431 0.0313 0.0728 0.0514 0.0365 0.0261 0.0708 0.0541 0.0600 0.0451 0.0508 0.0376 $1 PVn,i= (1 + i)n APPENDIX 9.2 Present value of an annuity of $1 per period. Periods 4% 1 2 0.9615 1.8861 3 2.7751 5% 6% 0.9524 0.9434 1.8594 1.8334 2.7232 2.6730 8% 9% 10% 4 3.6299 5 4.4518 7% 11% 12% 0.9346 0.9259 0.9174 0.9091 0.9009 0.8929 0.8850 0.8772 0.8621 0.8475 0.8333 1.8080 1.7833 1.7591 1.7355 1.7125 1.6901 1.6681 1.6467 1.6052 1.5656 1.5278 2.6243 2.5771 2.5313 2.4868 2.4437 2.4018 2.3612 2.3216 2.2459 2.1743 2.1065 3.5460 3.4651 3.3872 3.3121 3.2397 3.1698 3.1024 3.0373 2.9745 2.9137 2.7982 2.6901 2.5887 4.3295 4.2124 4.1002 3.9927 3.8897 3.7907 3.6959 3.6048 3.5172 3.4331 3.2743 3.1272 2.9906 13% 14% 16% 18% 20% 819 6 5.2421 7 6.0021 6.7327 9 7.4353 10 8.1109 5.0757 4.9173 4.7665 4.6229 4.4859 4.3553 5.7864 5.5824 5.3893 5.2064 5.0330 4.8684 6.4632 6.2098 5.9713 5.7466 5.5348 5.3349 7.1078 6.8017 6.5152 6.2469 5.9952 5.7590 7.7217 7.3601 7.0236 6.7101 6.4177 6.1446 4.2305 4.1114 3.9975 3.8887 3.6847 3.4976 3.3255 4.7122 4.5638 4.4226 4.2883 4.0386 3.8115 3.6046 5.1461 4.9676 4.7988 4.6389 4.3436 4.0776 3.8372 5.5370 5.3282 5.1317 4.9464 4.6065 4.3030 4.0310 5.8892 5.6502 5.4262 5.2161 4.8332 4.4941 4.1925 11 8.7605 12 9.3851 13 14 15 9.9856 10.5631 11.1184 8.3064 7.8869 7.4987 7.1390 6.8052 6.4951 6.2065 5.9377 8.8633 8.3838 7.9427 7.5361 7.1607 6.8137 6.4924 6.1944 9.3936 8.8527 8.3577 7.9038 7.4869 7.1034 6.7499 6.4235 9.8986 9.2950 8.7455 8.2442 7.7862 7.3667 6.9819 6.6282 10.3797 9.7122 9.1079 8.5595 8.0607 7.6061 7.1909 6.8109 5.6869 5.4527 5.0286 4.6560 4.3271 5.9176 5.6603 5.1971 4.7932 4.4392 6.1218 5.8424 5.3423 4.9095 4.5327 6.3025 6.0021 5.4675 5.0081 4.6106 6.4624 6.1422 5.5755 5.0916 4.6755 16 17 18 19 20 11.6523 10.8378 10.1059 9.4466 8.8514 8.3126 7.8237 12.1657 11.2741 10.4773 9.7632 9.1216 8.5436 8.0216 12.6593 11.6896 10.8276 10.0591 9.3719 8.7556 8.2014 13.1339 12.0853 11.1581 10.3356 9.6036 8.9501 8.3649 13.5903 12.4622 11.4699 10.5940 9.8181 9.1285 8.5136 7.3792 6.9740 7.5488 7.1196 7.7016 7.2497 7.8393 7.3658 7.9633 7.4694 6.6039 6.2651 5.6685 5.1624 4.7296 6.7291 6.3729 5.7487 5.2223 4.7746 6.8399 6.4674 5.8178 5.2732 4.8122 6.9380 6.5504 5.8775 5.3162 4.8435 7.0248 6.6231 5.9288 5.3527 4.8696 1 $1 (1+i)" PVAn,i = i James Smith is evaluating two new business opportunities. Each of the opportunities shown below has a 15-year life. James uses a 12% discount rate. Option 1 Option 2 Equipment purchase and installation $70,000 $80,500 Annual cash flow $27,000 $29,000 Equipment overhaul in year 6 $4,500 Equipment overhaul in year 8 $5,500 Click here to view the factor table. (a) Calculate the net present value of the two opportunities. (Round present value factor calculations to 4 decimal places, e.g. 1.2514 and the final answers to O decimal places, e.g. 59,991.) Net present value Option 1 Option 2
Step by Step Solution
There are 3 Steps involved in it
Step: 1

Get Instant Access to Expert-Tailored Solutions
See step-by-step solutions with expert insights and AI powered tools for academic success
Step: 2

Step: 3

Ace Your Homework with AI
Get the answers you need in no time with our AI-driven, step-by-step assistance
Get Started


