Answered step by step
Verified Expert Solution
Question
1 Approved Answer
calculate the ratio as below Financial Statements, Tootsie Roll ($000s) INCOME STATEMENT 2021 2020 2019 2018 2017 Total Revenue $570,776 $471,063 $527,113 $518,920 $519,289

| Financial Statements, Tootsie Roll ($000s) | ||||||||||||||||||
| INCOME STATEMENT | 2021 | 2020 | 2019 | 2018 | 2017 | |||||||||||||
| Total Revenue | $570,776 | $471,063 | $527,113 | $518,920 | $519,289 | |||||||||||||
| COGS & Royalty cost | 371,535 | 300,702 | 330,097 | 330,747 | 326,896 | |||||||||||||
| Gross profit | $199,241 | $170,361 | $197,016 | $188,173 | $192,393 | |||||||||||||
| SG & A expenses | 132,062 | 111,953 | 127,582 | 117,691 | 120,833 | |||||||||||||
| Other Income | 18,596 | 18,018 | 16,190 | 2,905 | 13,145 | |||||||||||||
| EBIT | $85,775 | $76,426 | $85,624 | $73,387 | $84,705 | |||||||||||||
| Interest Expense | $46 | $164 | $220 | $181 | $144 | |||||||||||||
| Before-tax earnings | $85,729 | $76,262 | $85,404 | $73,206 | $84,561 | |||||||||||||
| Taxes | 20,421 | 17,288 | 20,565 | 16,401 | 3,907 | |||||||||||||
| Minority Interest | 18 | 21 | 81 | 88 | 210 | |||||||||||||
| Net Income Attributable to Tootsie Roll Industries | $65,326 | $58,995 | $64,920 | $56,893 | $80,864 | |||||||||||||
| BALANCE SHEET, as of Dec 31 | 2021 | 2020 | 2019 | 2018 | 2017 | |||||||||||||
| ASSETS | ||||||||||||||||||
| Cash & Cash Equivalents | $106,226 | $167,256 | $139,340 | $111,287 | $96,720 | |||||||||||||
| Investments | $39,968 | $42,090 | $100,444 | $75,140 | $41,606 | |||||||||||||
| Accounts receivable | 54,921 | 41,209 | 45,044 | 49,777 | 47,354 | |||||||||||||
| Other Receivables | 3,920 | 3,894 | 3,418 | 2,941 | 5,425 | |||||||||||||
| Inventory | 55,505 | 59,579 | 59,088 | 54,524 | 54,827 | |||||||||||||
| Income Taxes Receivable | 0 | 0 | 0 | 0 | 12,974 | |||||||||||||
| Prepaid Expenses | 7,761 | 6,844 | 5,996 | 10,377 | 12,014 | |||||||||||||
| Deferred Income Taxes | 0 | 0 | 0 | 0 | 0 | |||||||||||||
| Current assets | $268,301 | $320,872 | $353,330 | $304,046 | $270,920 | |||||||||||||
| Gross Prop & Equip | 621,402 | 583,332 | 567,215 | 547,951 | 526,984 | |||||||||||||
| Less Accumulation Depreciation | (412,496) | (396,004) | (378,760) | (361,850) | (348,012) | |||||||||||||
| Net Prop & Equip | $208,906 | $187,328 | $188,455 | $186,101 | $178,972 | |||||||||||||
| Goodwill | 73,237 | 73,237 | 73,237 | 73,237 | 73,237 | |||||||||||||
| Trademarks | 175,024 | 175,024 | 175,024 | 175,024 | 175,024 | |||||||||||||
| Investments (long term) | 291,175 | 220,020 | 153,031 | 170,409 | 190,510 | |||||||||||||
| Other Assets | 1,975 | 8,077 | 34,787 | 38,544 | 42,283 | |||||||||||||
| Total Assets | $1,018,618 | $984,558 | $977,864 | $947,361 | $930,946 | |||||||||||||
| LIABILITIES AND EQUITIES | ||||||||||||||||||
| Accounts payable | $14,969 | $13,025 | $12,720 | $11,817 | $11,928 | |||||||||||||
| Bank Loans (short term) | $939 | $832 | $747 | $373 | $440 | |||||||||||||
| Dividends payable | 6,042 | 5,948 | 5,861 | 5,772 | 5,660 | |||||||||||||
| Accrued Liabilities | 53,896 | 45,099 | 41,611 | 42,849 | 45,157 | |||||||||||||
| Other current liabilities | 4,122 | 5,117 | 18,605 | 580 | 603 | |||||||||||||
| Current liabilities | $79,968 | $70,021 | $79,544 | $61,391 | $63,788 | |||||||||||||
| Bank Loans | $0 | $0 | $0 | $0 | $0 | |||||||||||||
| Deferred Income Taxes | 45,461 | 47,900 | 47,295 | 43,941 | 41,457 | |||||||||||||
| Other liabilities | 124,392 | 103,537 | 91,376 | 91,532 | 91,897 | |||||||||||||
| Total Liabilities | $249,821 | $221,458 | $218,215 | $196,864 | $197,142 | |||||||||||||
| Common stock | 27,322 | 27,134 | 26,969 | 26,767 | 26,361 | |||||||||||||
| Class B Common Stock | 19,300 | 18,758 | 18,254 | 17,767 | 17,285 | |||||||||||||
| Capital in excess of par | 709,880 | 706,930 | 696,059 | 696,535 | 656,752 | |||||||||||||
| Retained earnings | 39,545 | 32,312 | 40,809 | 33,767 | 57,225 | |||||||||||||
| Accumulated Other Comprehensive Loss* | (25,013) | (19,815) | (20,245) | (22,222) | (21,791) | |||||||||||||
| Treasury Stock | (1,992) | (1,992) | (1,992) | (1,992) | (1,992) | |||||||||||||
| Non-Controllling Interests | (245) | (227) | (205) | (125) | (36) | |||||||||||||
| Total Equity | $768,797 | $763,100 | $759,649 | $750,497 | $733,804 | |||||||||||||
| Total Liabilities & Equity | $1,018,618 | $984,558 | $977,864 | $947,361 | $930,946 | |||||||||||||
| can you provide the answers for below for each year | ||||||||||||||||||
| Tootsie Roll | ||||||||||||||||||
| 2021 | 2020 | 2019 | 2018 | |||||||||||||||
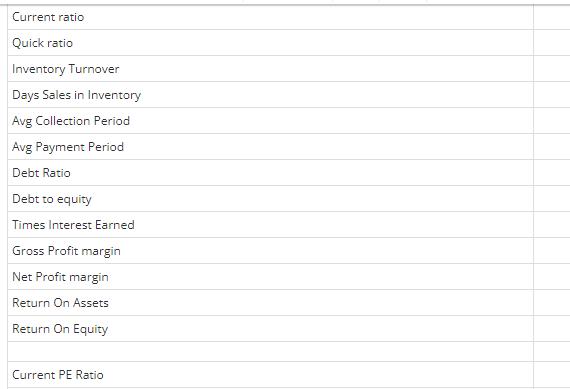
Current ratio Quick ratio Inventory Turnover Days Sales in Inventory Avg Collection Period Avg Payment Period Debt Ratio Debt to equity Times Interest Earned Gross Profit margin Net Profit margin Return On Assets Return On Equity Current PE Ratio
Step by Step Solution
There are 3 Steps involved in it
Step: 1

Get Instant Access to Expert-Tailored Solutions
See step-by-step solutions with expert insights and AI powered tools for academic success
Step: 2

Step: 3

Ace Your Homework with AI
Get the answers you need in no time with our AI-driven, step-by-step assistance
Get Started


