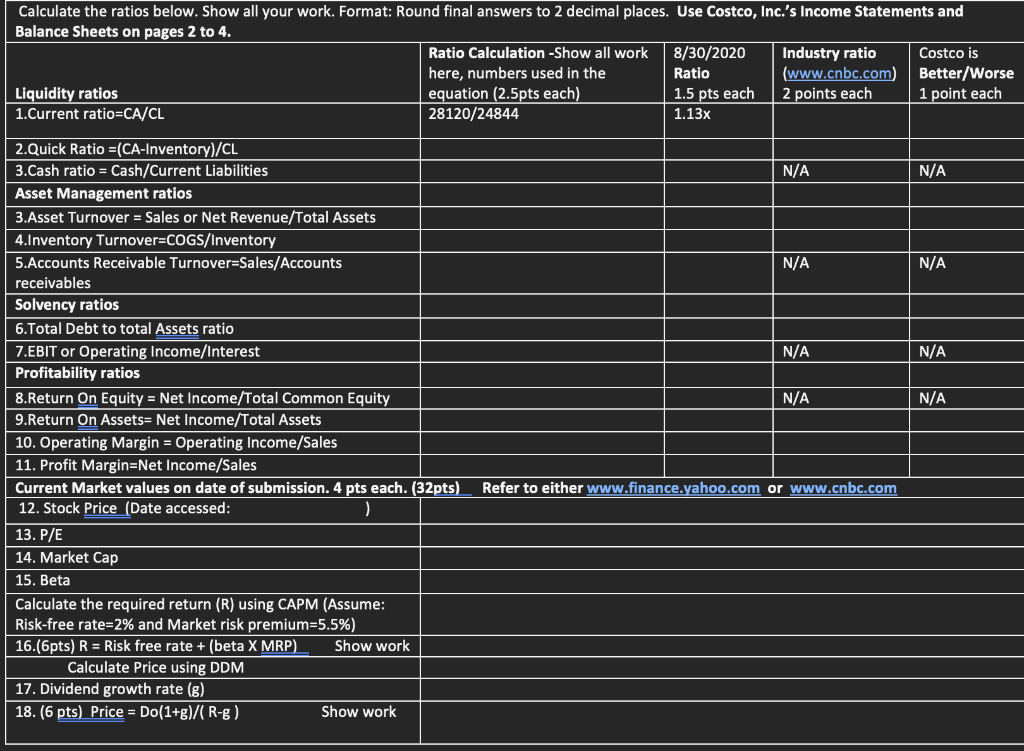
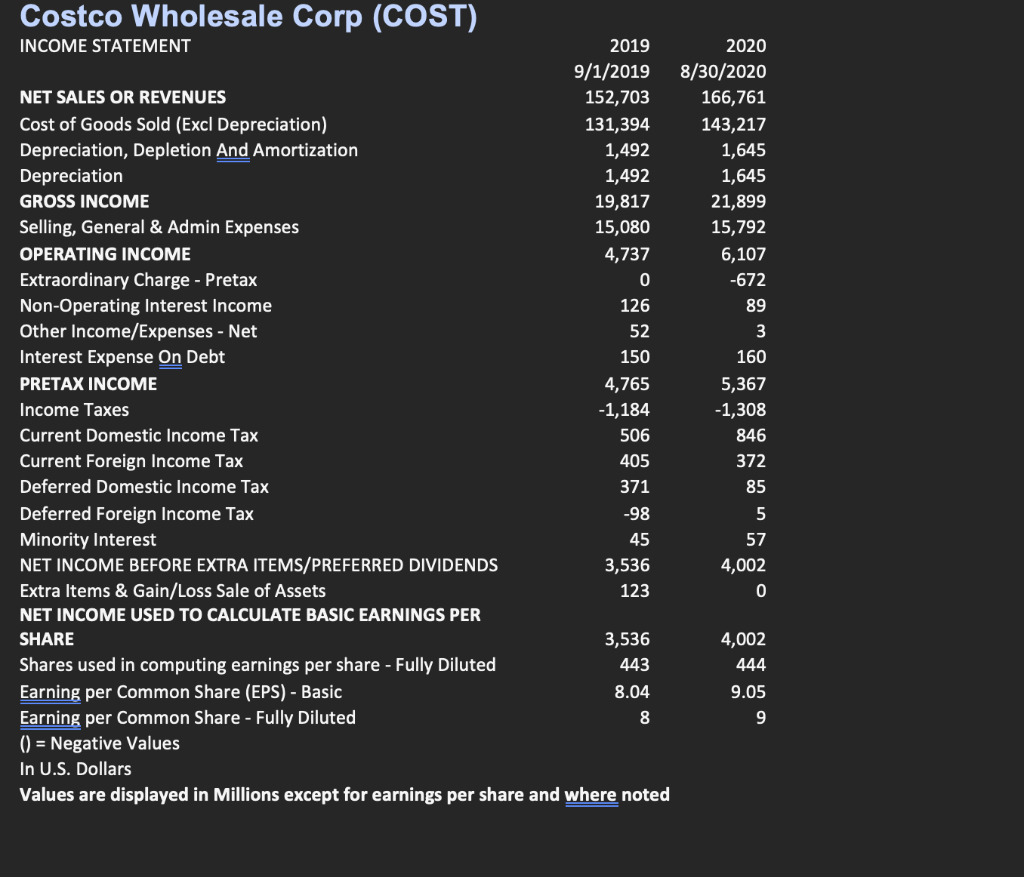
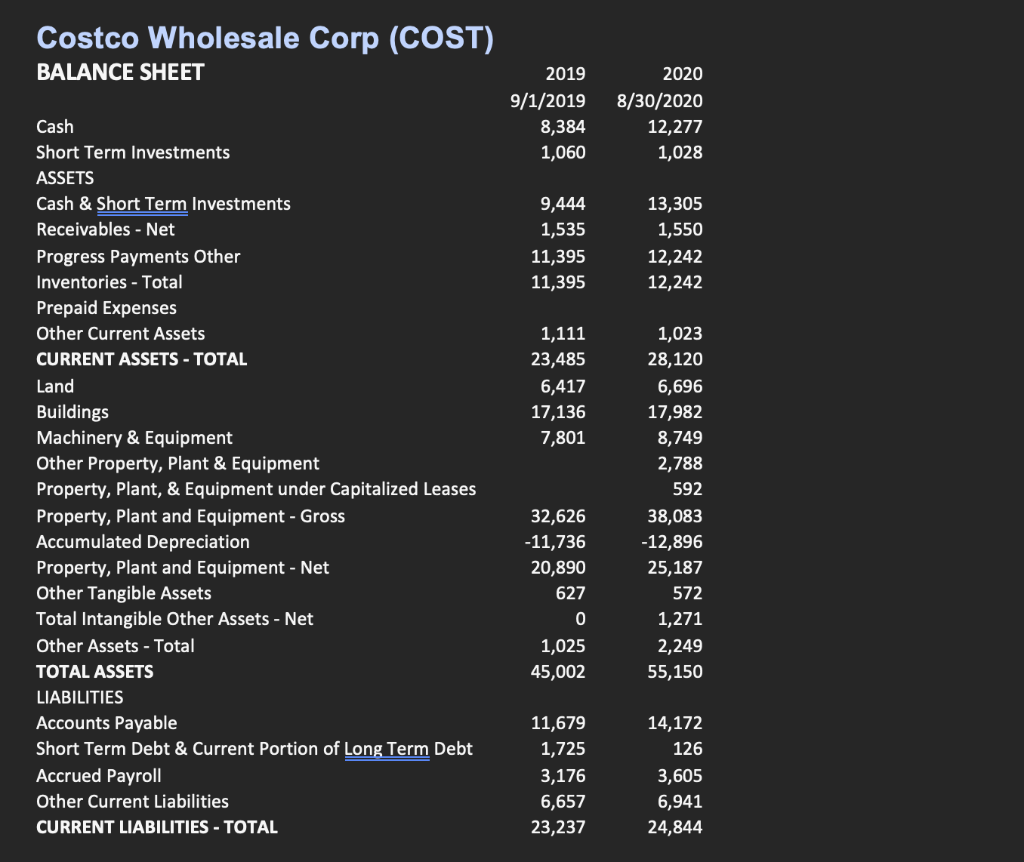
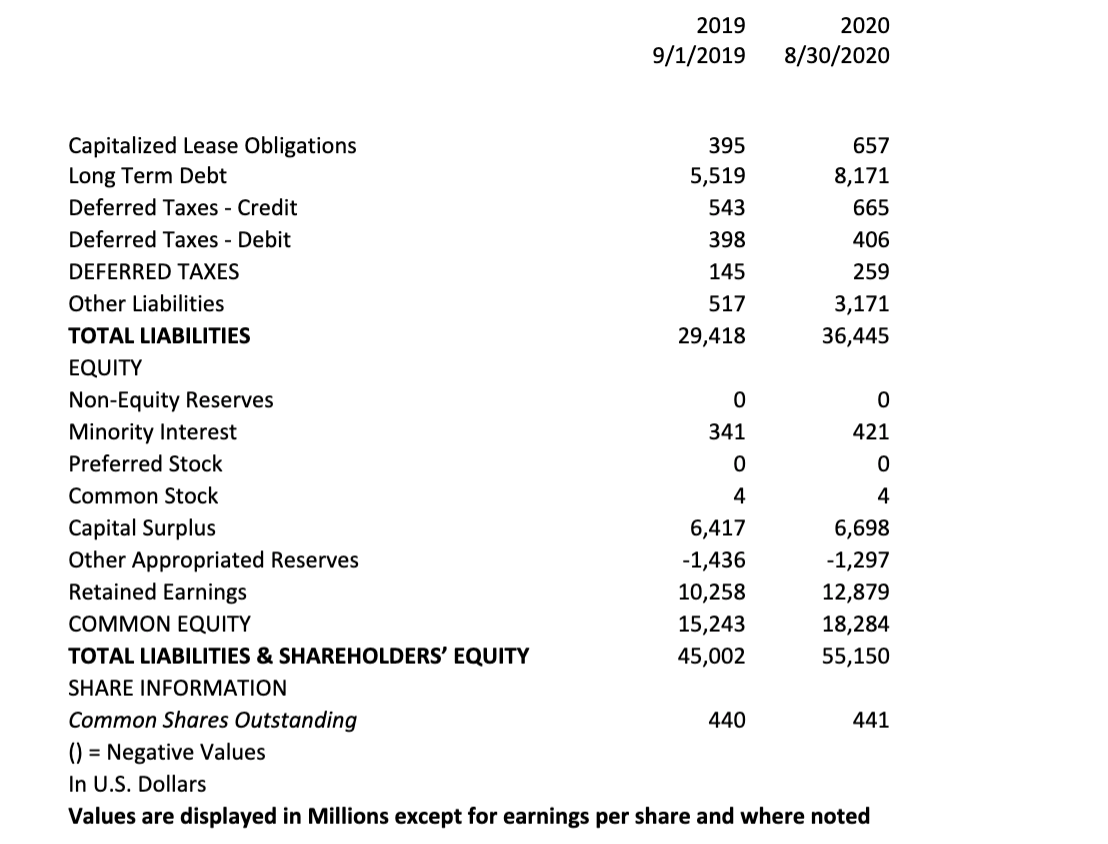
Calculate the ratios below. Show all your work. Format: Round final answers to 2 decimal places. Use Costco, Inc.'s Income Statements and Balance Sheets on pages 2 to 4. Ratio Calculation -Show all work 8/30/2020 Industry ratio Costco is here, numbers used in the Ratio (www.cnbc.com) Better/Worse Liquidity ratios equation (2.5pts each) 1.5 pts each 2 points each 1 point each 1.Current ratio=CA/CL 28120/24844 1.13x N/A N/A N/A N/A N/A N/A N/A N/A 2.Quick Ratio =(CA-Inventory)/CL 3.Cash ratio = Cash/Current Liabilities Asset Management ratios 3.Asset Turnover = Sales or Net Revenue/Total Assets 4.Inventory Turnover=COGS/Inventory 5.Accounts Receivable Turnover=Sales/Accounts receivables Solvency ratios 6.Total Debt to total Assets ratio 7.EBIT or Operating Income/Interest Profitability ratios 8.Return On Equity = Net Income/Total Common Equity 9. Return On Assets=Net Income/Total Assets 10. Operating Margin = Operating Income/Sales 11. Profit Margin=Net Income/Sales Current Market values on date of submission. 4 pts each. (32pts) 12. Stock Price (Date accessed: ) 13. P/E 14. Market Cap 15. Beta Calculate the required return (R) using CAPM (Assume: Risk-free rate=2% and Market risk premium=5.5%) 16.(6pts) R = Risk free rate +(beta X MRP) Show work Calculate Price using DDM 17. Dividend growth rate (g) 18. (6 pts) Price = Do(1+g)/(R-8) Show work Refer to either www.finance.yahoo.com or www.cnbc.com Costco Wholesale Corp (COST) INCOME STATEMENT 2019 9/1/2019 NET SALES OR REVENUES 152,703 Cost of Goods Sold (Excl Depreciation) 131,394 Depreciation, Depletion And Amortization 1,492 Depreciation 1,492 GROSS INCOME 19,817 Selling, General & Admin Expenses 15,080 OPERATING INCOME 4,737 Extraordinary Charge - Pretax 0 Non-Operating Interest Income 126 Other Income/Expenses - Net 52 Interest Expense On Debt 150 PRETAX INCOME 4,765 Income Taxes -1,184 Current Domestic Income Tax 506 Current Income Tax 405 Deferred Domestic Income Tax 371 Deferred Foreign Income Tax -98 Minority Interest 45 NET INCOME BEFORE EXTRA ITEMS/PREFERRED DIVIDENDS 3,536 Extra Items & Gain/Loss Sale of Assets 123 NET INCOME USED TO CALCULATE BASIC EARNINGS PER SHARE 3,536 Shares used in computing earnings per share - Fully Diluted 443 Earning per Common Share (EPS) - Basic 8.04 Earning per Common Share - Fully Diluted 8 () = Negative Values In U.S. Dollars Values are displayed in Millions except for earnings per share and where noted 2020 8/30/2020 166,761 143,217 1,645 1,645 21,899 15,792 6,107 -672 89 3 160 5,367 -1,308 846 372 85 5 57 4,002 0 4,002 444 9.05 9 Costco Wholesale Corp (COST) BALANCE SHEET 2019 9/1/2019 8,384 1,060 2020 8/30/2020 12,277 1,028 9,444 1,535 11,395 11,395 13,305 1,550 12,242 12,242 1,111 23,485 6,417 17,136 7,801 Cash Short Term Investments ASSETS Cash & Short Term Investments Receivables - Net Progress Payments Other Inventories - Total Prepaid Expenses Other Current Assets CURRENT ASSETS - TOTAL Land Buildings Machinery & Equipment Other Property, Plant & Equipment Property, Plant, & Equipment under Capitalized Leases Property, Plant and Equipment - Gross Accumulated Depreciation Property, Plant and Equipment - Net Other Tangible Assets Total Intangible Other Assets - Net Other Assets - Total TOTAL ASSETS LIABILITIES Accounts Payable Short Term Debt & Current Portion of Long Term Debt Accrued Payroll Other Current Liabilities CURRENT LIABILITIES - TOTAL 1,023 28,120 6,696 17,982 8,749 2,788 592 38,083 -12,896 25,187 572 1,271 2,249 55,150 32,626 -11,736 20,890 627 0 1,025 45,002 11,679 1,725 3,176 6,657 23,237 14,172 126 3,605 6,941 24,844 2019 9/1/2019 2020 8/30/2020 341 421 Capitalized Lease Obligations 395 657 Long Term Debt 5,519 8,171 Deferred Taxes - Credit 543 665 Deferred Taxes - Debit 398 406 DEFERRED TAXES 145 259 Other Liabilities 517 3,171 TOTAL LIABILITIES 29,418 36,445 EQUITY Non-Equity Reserves 0 0 Minority Interest Preferred Stock 0 0 Common Stock 4 4 Capital Surplus 6,417 6,698 Other Appropriated Reserves -1,436 -1,297 Retained Earnings 10,258 12,879 COMMON EQUITY 15,243 18,284 TOTAL LIABILITIES & SHAREHOLDERS' EQUITY 45,002 55,150 SHARE INFORMATION Common Shares Outstanding 440 441 () = Negative Values In U.S. Dollars Values are displayed in Millions except for earnings per share and where noted