calculate the ratios for the year 2013
(this was the annual report collected from bursa malaysia, some informations are not there)
Receivable Turnover = Net Credit Sales Accounts Receivable Days Sales Outstanding = 360 Days Receivable Turnover Inventory Turnover = Cost of Sales Inventory Days Inventory Outstanding = 360 Days Inventory Turnover
Accounts Payable Turnover = Net Credit Purchases Accounts Payable
Days Payable Outstanding = 360 Days Accounts Payable Turnover
Operating Cycle = Days Inventory Outstanding + Days Sales Outstanding
Cash Conversion Cycle = Operating Cycle - Days Payable Outstanding
Total Asset Turnover = Net Sales Total Assets
Times Interest Earned = EBIT Interest Expense
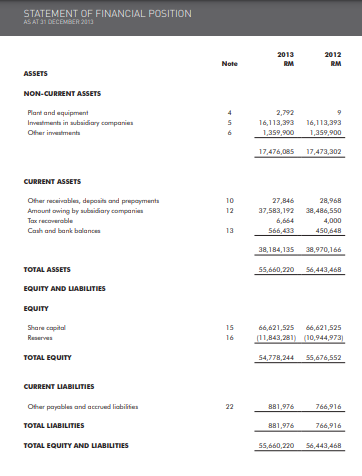
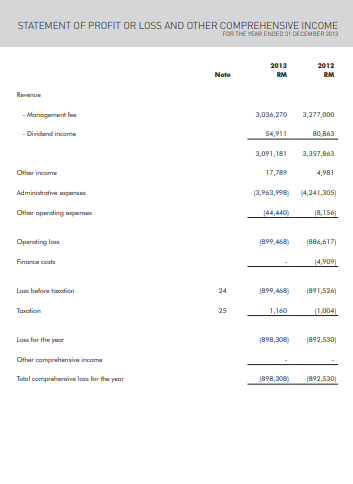
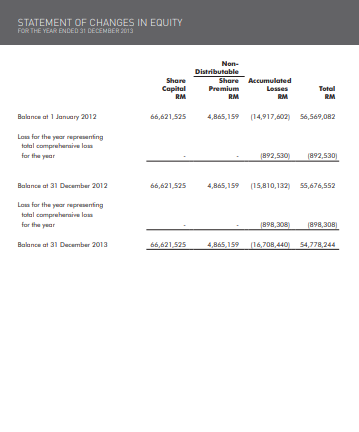
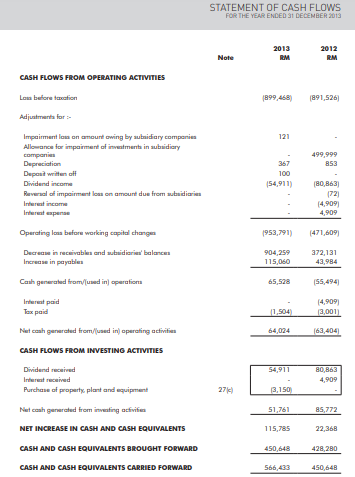
STATEMENT OF FINANCIAL POSITION AS AT 31 DECEMBER 2013 2013 RM 2012 RM Note ASSETS NON-CURRENT ASSETS Plant and equipment Investments in whidiary companies Oferiments 2,792 16,113,393 1,359,900 16,113,393 1,359,900 17,476,085 17,473,302 CURRENT ASSETS Other receivable, deposit and prepayment Amount owing by subsidiary companies Tex recoverable Cash and bank balones 10 12 27,846 28,968 37,583,192 38,486,550 6,664 4,000 566,433 450,648 13 38,184,135 38,970,166 55,660,220 56,443,468 TOTAL ASSETS EQUITY AND LIABILITIES EQUITY Share capital Reserves 15 16 66,621,525 66,621,525 (11,843,281) (10.944,973) 54,778,244 56,676,552 TOTAL EQUITY CURRENT LIABILITIES 22 881,976 766,916 Other payables and accrued liabilities TOTAL LIABILITIES 881,976 766,916 TOTAL EQUITY AND LIABILITIES 55,660,220 56,443,468 STATEMENT OF PROFIT OR LOSS AND OTHER COMPREHENSIVE INCOME FOR THE YEAR ENDED 31 DECEMBER 2013 2013 ROM Note 2012 ROM Ruvu - Management 3,036,270 3,277,000 - Dividend income 54,911 80,863 3,091,181 3,357,863 Other income 17,789 4,981 Administrative pins (3,963,998) 14,241,305) Other operating per 44,440) 18,156) Operatings 899,468 886,617) Finance costs 14,909 Low baloreation 24 899,468 1891,526 Tencation 25 1,160 11,004 Les for the year 1898,308 1892,530) Other comprehensive income Total comprehemivel for the year 898,308 1892,5301 STATEMENT OF CHANGES IN EQUITY FOR THE YEAR ENDED 31 DECEMBER 2013 Share Capital RM Non- Distributable Share Accumulated Premium Losses RM Total RM Balance at 1 January 2012 66,621,525 4,865,159 (14,917,602) 56,569,082 Low for the year reprowning total comprehensive lom for the year 892,530) 892,530 66,621,525 4,865,159 15,810,132) 55,676,552 Balance at 31 December 2012 Low for the year representing total comprehensive lom for the year 1898,308) 1898,308 Balance at 31 December 2013 66,621,525 4,865,159 16,708,440 54,778,244 STATEMENT OF CASH FLOWS FOR THE YEAR ENDED 31 DECEMBER 2013 Note 2013 RM 2012 RUM CASH FLOWS FROM OPERATING ACTIVITIES Low before creation 899,468) (891,526 Adjustments for 121 367 499,999 853 Impairment loan amount wing by subsidiary companies Allowance for impairment of investments in subsidiary companies Depreciation Depost written att Dividend income Revenal al impairment loa on amount due from autuidiaries Interest income Interest aspense 100 154,911) (80,863 1721 (4,909 4,909 Operating on before working capital changes 1953,791) Decrease in receivables and wided balance Increase in payables 904,259 115,060 (471,609 372,131 43,984 Cash generated from/(wed in sperations 65,528 (55,494 Interest paid Tex paid 11,504 (4,909 2,001) 64,024 (63,404 54,911 Netcosh generated from/used in operating activities CASH FLOWS FROM INVESTING ACTIVITIES Dividend received Interest received Purchase of property, plant and equipment Nel coah generated from investing activities NET INCREASE IN CASH AND CASH EQUIVALENTS 80,863 4,909 274 13,150 51,761 85,772 115,785 22,368 450,648 428,280 CASH AND CASH EQUIVALENTS BROUGHT FORWARD CASH AND CASH EQUIVALENTS CARRIED FORWARD 566,433 450,648


