Answered step by step
Verified Expert Solution
Link Copied!

Question

1 Approved Answer

Calculate the real exchange rate, nominal effective and real effective exchange rates for Pakistan for at least 10 years using the given trade shares; European

  1. Calculate the real exchange rate, nominal effective and real effective exchange rates for Pakistan for at least 10 years using the given trade shares; European market union-33%, China - 24% and USA 16%.
  1. Analyze the relationship between the exchange rates calculated using graph.
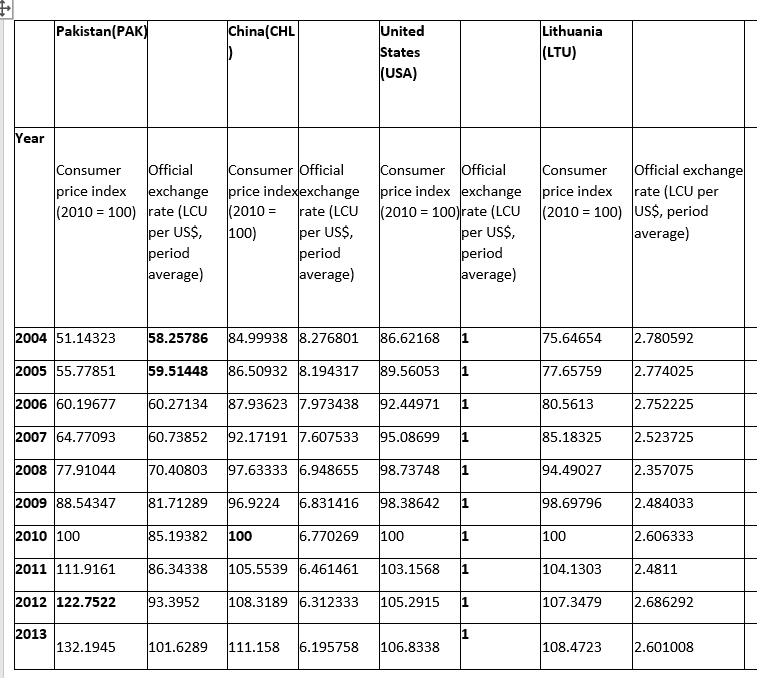
image text in transcribed

Pakistan(PAK) China(CHL ) United States (USA) Lithuania (LTU) Year Consumer Official Consumer Official Consumer Official price index exchange price indexexchange price index exchange (2010 = 100) rate (LCU (2010 = rate (LCU (2010 = 100)rate (LCU per US$, 100) per US$, per US$, period period period average) average) average) Consumer Official exchange price index rate (LCU per (2010 = 100) US$, period average) 2004 51.14323 58.25786 84.99938 8.276801 86.62168 75.64654 2.780592 2005 55.77851 59.51448 86.50932 8.194317 89.56053 1 77.65759 2.774025 2006 60.19677 60.27134 87.93623 7.973438 92.44971 1 80.5613 2.752225 2007 64.77093 60.73852 92.17191 7.607533 95.08699 85.18325 2.523725 2008 77.91044 70.40803 97.63333 6.948655 98.73748 1 94.49027 2.357075 2009 88.54347 81.71289 96.9224 6.831416 98.38642 1 98.69796 2.484033 2010 100 85.19382 100 6.770269 100 100 2.606333 2011 111.9161 86.34338 105.5539 6.461461 103.1568 1 104.1303 2.4811 2012 122.7522 93.3952 108.3189 6.312333 105.2915 1 107.3479 2.686292 2013 132.1945 1 101.6289 111.158 6.195758 106.8338 108.4723 2.601008 Pakistan(PAK) China(CHL ) United States (USA) Lithuania (LTU) Year Consumer Official Consumer Official Consumer Official price index exchange price indexexchange price index exchange (2010 = 100) rate (LCU (2010 = rate (LCU (2010 = 100)rate (LCU per US$, 100) per US$, per US$, period period period average) average) average) Consumer Official exchange price index rate (LCU per (2010 = 100) US$, period average) 2004 51.14323 58.25786 84.99938 8.276801 86.62168 75.64654 2.780592 2005 55.77851 59.51448 86.50932 8.194317 89.56053 1 77.65759 2.774025 2006 60.19677 60.27134 87.93623 7.973438 92.44971 1 80.5613 2.752225 2007 64.77093 60.73852 92.17191 7.607533 95.08699 85.18325 2.523725 2008 77.91044 70.40803 97.63333 6.948655 98.73748 1 94.49027 2.357075 2009 88.54347 81.71289 96.9224 6.831416 98.38642 1 98.69796 2.484033 2010 100 85.19382 100 6.770269 100 100 2.606333 2011 111.9161 86.34338 105.5539 6.461461 103.1568 1 104.1303 2.4811 2012 122.7522 93.3952 108.3189 6.312333 105.2915 1 107.3479 2.686292 2013 132.1945 1 101.6289 111.158 6.195758 106.8338 108.4723 2.601008

Step by Step Solution

There are 3 Steps involved in it

Step: 1

blur-text-image

Get Instant Access to Expert-Tailored Solutions

See step-by-step solutions with expert insights and AI powered tools for academic success

Step: 2

blur-text-image_2

Step: 3

blur-text-image_3

Ace Your Homework with AI

Get the answers you need in no time with our AI-driven, step-by-step assistance

Get Started

Recommended Textbook for

Trading Systems Theory And Immediate Practice

Authors: Renato Di Lorenzo

1st Edition

8847027055,8847027063

More Books

Students also viewed these Finance questions

Question

What are the benefits of being part of a group? And the problems?

Answered: 1 week ago