Answered step by step
Verified Expert Solution
Question
1 Approved Answer
calculate the unlevered free cash flow for the five year projection period 2008 2009 2010 2011 2012 Revenue Projections Service Revenue $ 4,194.3 $ 4,781.5
calculate the unlevered free cash flow for the five year projection period 

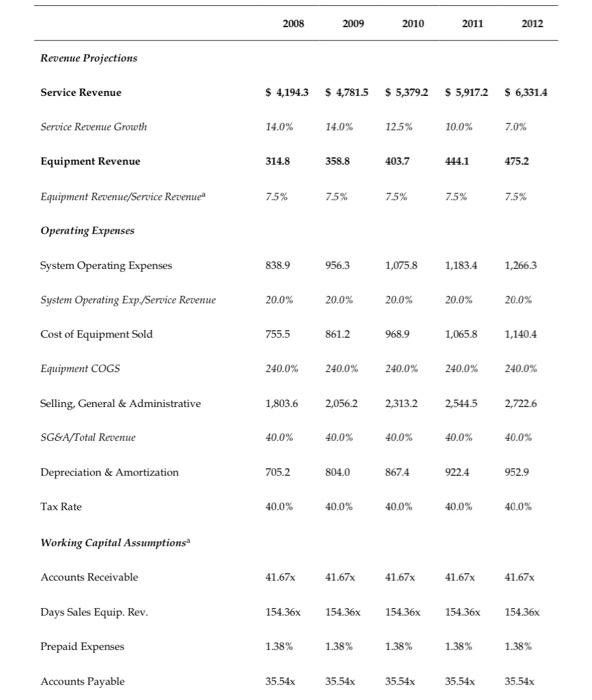
2008 2009 2010 2011 2012 Revenue Projections Service Revenue $ 4,194.3 $ 4,781.5 $ 5,3792 $ 5,917.2 $ 6,331.4 Service Revenue Growth 14.0% 14.0% 12.5% 10.0% 7.0% Equipment Revenue 314.8 358.8 403.7 444.1 475.2 Equipment Revenue/Service Revenue 7.5% 75% 7.5% 7.5% 7.5% Operating Expenses System Operating Expenses 838.9 956.3 1,075.8 1,183.4 1,266.3 System Operating Exp./Service Revenue 20.0% 20.0% 20.0% 20.0% 20.0% Cost of Equipment Sold 755.5 8612 968.9 1,065.8 1.140.4 Equipment COGS 240.0% 240.0% 240.0% 240.0% 240.0% Selling, General & Administrative 1,803.6 2,056.2 2,3132 2.544.5 2,7226 SG&A/Total Revenue 40.0% 40.0% 40.0% 40.0% 40.0% Depreciation & Amortization 705.2 804.0 8674 9224 952.9 Tax Rate 40.0% 40.0% 40.0% 40.0% 40.0% Working Capital Assumptions Accounts Receivable 41.67x 41.67% 41.67% 41.67x 41.67x Days Sales Equip. Rev. 154.36x 154.36x 154.36x 154.36x 154.36x Prepaid Expenses 1.38% 1.38% 1.38% 1.38% 1.38% Accounts Payable 35.54x 35.54x 35.54x 35.54x 35.54x Deferred Serv. Revenue 14.01x 14.01% 14.01x 14.01% 14.01% Accrued Liabilities 6.85% 6.85% 6,85x 6.85% 6.85% Capital Expenditures Capital Expenditures 631.3 719.7 8674 970.1 1,055.0 Cap-x/Total Revenue 14.0% 14.0% 15.0% 15.3% 15.5% 

Step by Step Solution
There are 3 Steps involved in it
Step: 1

Get Instant Access to Expert-Tailored Solutions
See step-by-step solutions with expert insights and AI powered tools for academic success
Step: 2

Step: 3

Ace Your Homework with AI
Get the answers you need in no time with our AI-driven, step-by-step assistance
Get Started


