

Question
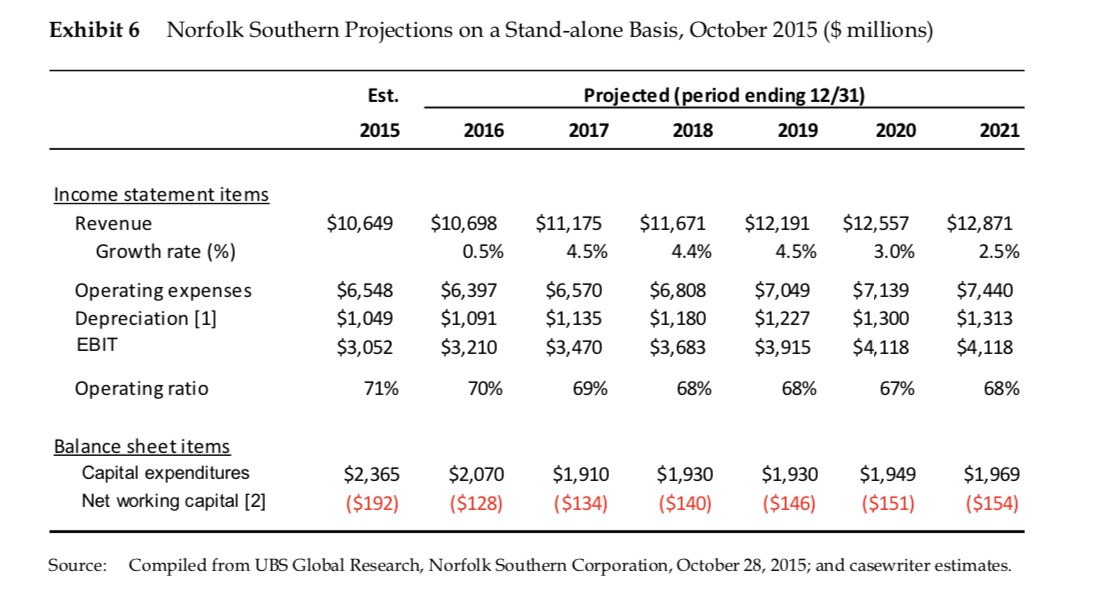
Calculate the WACC to be used as the discount rate to Present Value the cash flows for NS. (See Pointers below for assumptions to use
Calculate the WACC to be used as the discount rate to Present Value the cash flows for NS. (See Pointers below for assumptions to use in order to calculate the Cost of equity (Re), and WACC.) Using the financial projections in Exhibit 6 of the case and the WACC that you just calculated, determine the stand-alone intrinsic value of NS shares. Other Details: Risk Free Rate= 2.9% (Found in Exh. 11 of case) EMRP=5.5% Beta=1.16 Tax rate=36% Note this should also be used for the DCF analyses Target Capital Structure=20% debt and 80% equity (this is deemed to be average for the Railroad industry)
Required (pre-tax) Return on Debt= 3.7 (Below values in million) Cash = $433, Equity(market value)= $23,027 Debt= $9496,
Step by Step Solution
There are 3 Steps involved in it
Step: 1

Get Instant Access to Expert-Tailored Solutions
See step-by-step solutions with expert insights and AI powered tools for academic success
Step: 2

Step: 3
Ace Your Homework with AI
Get the answers you need in no time with our AI-driven, step-by-step assistance
Get Started
The Strategies Of Chinas Firms Resolving Dilemmas
Authors: Hailan Yang, Stephen Morgan , Ying Wang
1st Edition
0081002742,0081002769