

Answered step by step
Verified Expert Solution
Question
1 Approved Answer
Calculations and graph please! Duquesne forms an optimal risky portfolio using seven passive Exchange Traded Funds. The firm's research analysts have come up with the
Calculations and graph please! 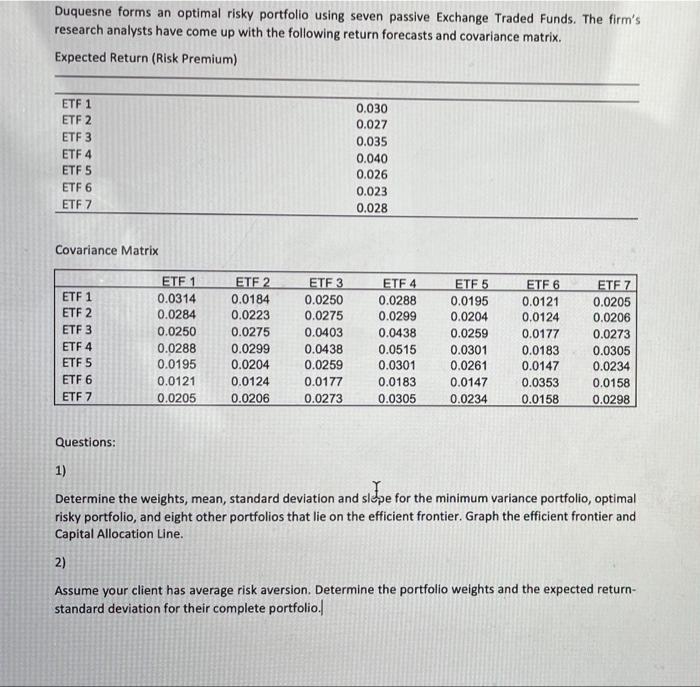
Duquesne forms an optimal risky portfolio using seven passive Exchange Traded Funds. The firm's research analysts have come up with the following return forecasts and covariance matrix. Expected Return (Risk Premium) ETF 1 ETF 2 ETF 3 ETF 4 ETF 5 ETF 6 ETF7 0.030 0.027 0.035 0.040 0.026 0.023 0.028 Covariance Matrix ETF 1 ETF 2 ETF 3 ETF 4 ETF 5 ETF 6 ETF 7 ETF 1 0.0314 0.0284 0.0250 0.0288 0.0195 0.0121 0.0205 ETF 2 0.0184 0.0223 0.0275 0.0299 0.0204 0.0124 0.0206 ETF 3 0.0250 0.0275 0.0403 0.0438 0.0259 0.0177 0.0273 ETF 4 0.0288 0.0299 0.0438 0.0515 0.0301 0.0183 0.0305 ETF 5 0.0195 0.0204 0.0259 0.0301 0.0261 0.0147 0.0234 ETF 6 0.0121 0.0124 0.0177 0.0183 0.0147 0.0353 0.0158 ETF 7 0.0205 0.0206 0.0273 0.0305 0.0234 0.0158 0.0298 Questions: 1) Determine the weights, mean, standard deviation and slepe for the minimum variance portfolio, optimal risky portfolio, and eight other portfolios that lie on the efficient frontier. Graph the efficient frontier and Capital Allocation Line. 2) Assume your client has average risk aversion. Determine the portfolio weights and the expected return- standard deviation for their complete portfolio. Duquesne forms an optimal risky portfolio using seven passive Exchange Traded Funds. The firm's research analysts have come up with the following return forecasts and covariance matrix. Expected Return (Risk Premium) ETF 1 ETF 2 ETF 3 ETF 4 ETF 5 ETF 6 ETF7 0.030 0.027 0.035 0.040 0.026 0.023 0.028 Covariance Matrix ETF 1 ETF 2 ETF 3 ETF 4 ETF 5 ETF 6 ETF 7 ETF 1 0.0314 0.0284 0.0250 0.0288 0.0195 0.0121 0.0205 ETF 2 0.0184 0.0223 0.0275 0.0299 0.0204 0.0124 0.0206 ETF 3 0.0250 0.0275 0.0403 0.0438 0.0259 0.0177 0.0273 ETF 4 0.0288 0.0299 0.0438 0.0515 0.0301 0.0183 0.0305 ETF 5 0.0195 0.0204 0.0259 0.0301 0.0261 0.0147 0.0234 ETF 6 0.0121 0.0124 0.0177 0.0183 0.0147 0.0353 0.0158 ETF 7 0.0205 0.0206 0.0273 0.0305 0.0234 0.0158 0.0298 Questions: 1) Determine the weights, mean, standard deviation and slepe for the minimum variance portfolio, optimal risky portfolio, and eight other portfolios that lie on the efficient frontier. Graph the efficient frontier and Capital Allocation Line. 2) Assume your client has average risk aversion. Determine the portfolio weights and the expected return- standard deviation for their complete portfolio Step by Step Solution
There are 3 Steps involved in it
Step: 1

Get Instant Access to Expert-Tailored Solutions
See step-by-step solutions with expert insights and AI powered tools for academic success
Step: 2

Step: 3
Ace Your Homework with AI
Get the answers you need in no time with our AI-driven, step-by-step assistance
Get Started
Financial Management for Public Health and Not for Profit Organizations
Authors: Steven A. Finkler, Thad Calabrese
4th edition
133060411, 132805669, 9780133060416, 978-0132805667