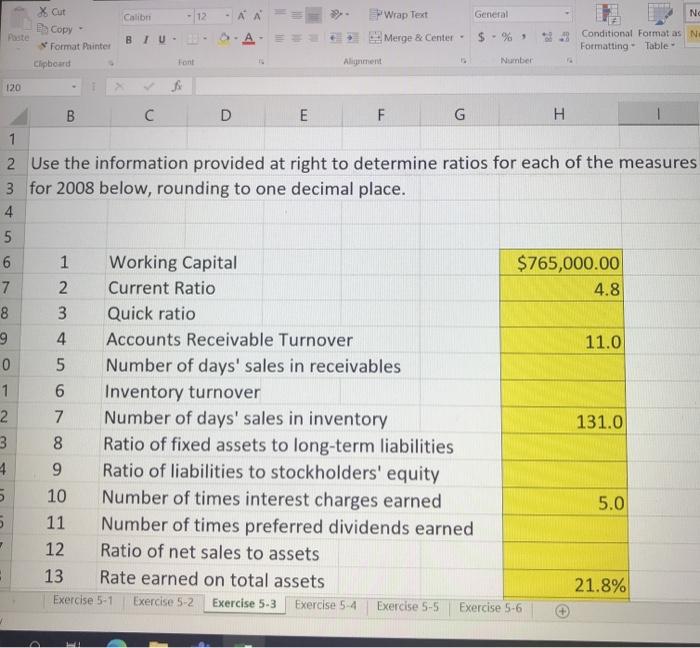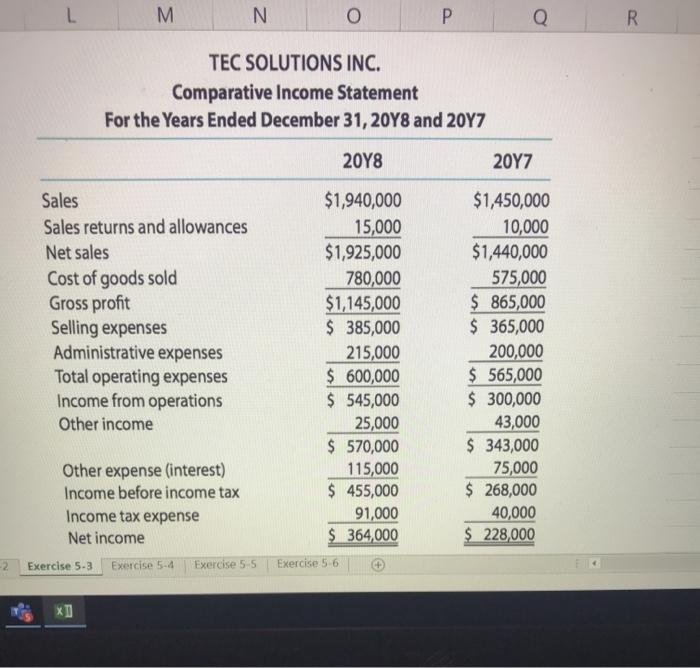
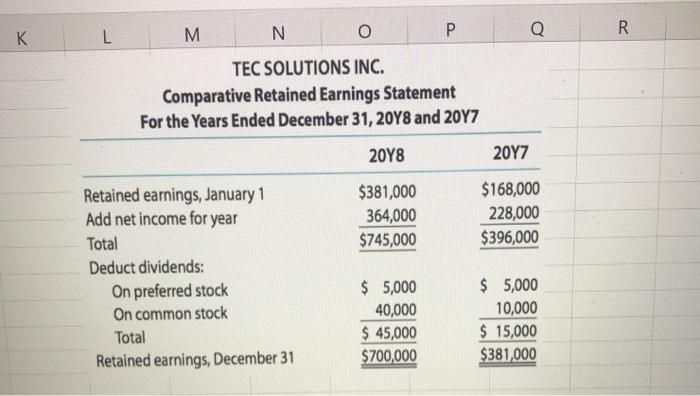
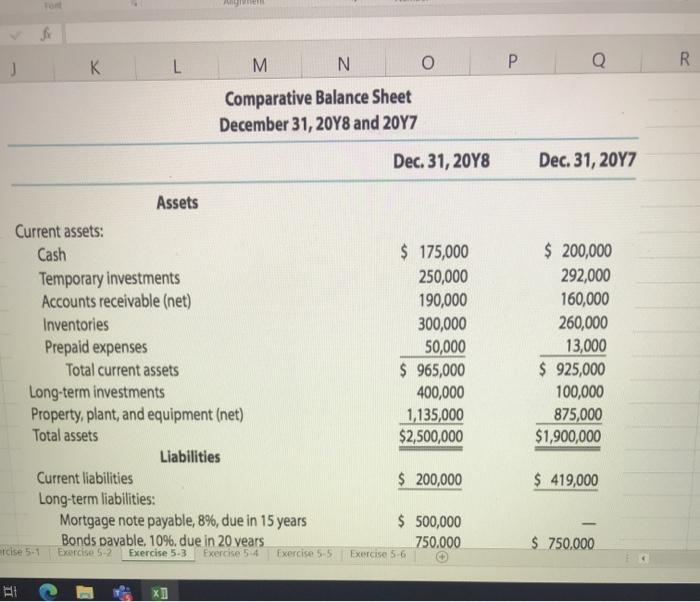
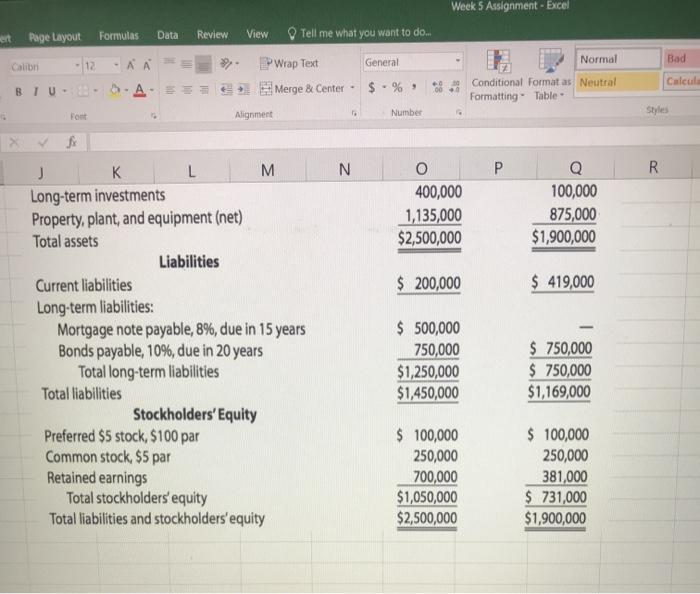
Calib 12 EPWrap Text General X Cut E Copy - Format Paunter Clipboard A SA BTU- NO Conditional Format as N Formatting - Table - Merge & Center - $ - % Alignment Number 120 B C D E F G H 1 2 Use the information provided at right to determine ratios for each of the measures 3 for 2008 below, rounding to one decimal place. 4 5 6 1 Working Capital $765,000.00 7 2 Current Ratio 4.8 8 3 Quick ratio 4 Accounts Receivable Turnover 11.0 0 5 Number of days' sales in receivables 1 6 Inventory turnover 2 7 Number of days' sales in inventory 131.0 3 8 Ratio of fixed assets to long-term liabilities 4 9 Ratio of liabilities to stockholders' equity 5 10 Number of times interest charges earned 5.0 5 11 Number of times preferred dividends earned 12 Ratio of net sales to assets Rate earned on total assets 21.8% Exercise 5-1 Exercise 5-3 Exercise 5-6 13 Exercise 5-2 Exercise 54 Exercise 5-5 L M N O Q R TEC SOLUTIONS INC. Comparative Income Statement For the Years Ended December 31, 2048 and 2017 20Y8 2017 Sales Sales returns and allowances Net sales Cost of goods sold Gross profit Selling expenses Administrative expenses Total operating expenses Income from operations Other income $1,940,000 15,000 $1,925,000 780,000 $1,145,000 $ 385,000 215,000 $ 600,000 $ 545,000 25,000 $ 570,000 115,000 $ 455,000 91,000 $ 364,000 $1,450,000 10,000 $1,440,000 575,000 $ 865,000 $365,000 200,000 $ 565,000 $ 300,000 43,000 $ 343,000 75,000 $ 268,000 40,000 $ 228,000 Other expense (interest) Income before income tax Income tax expense Net income Exercise 5.3 Exercise 5-4 Exercise 5-5 -2 Exercise 5 6 * L K M N R O Q TEC SOLUTIONS INC. Comparative Retained Earnings Statement For the Years Ended December 31, 2048 and 2047 20Y8 2017 $381,000 364,000 $745,000 $168,000 228,000 $396,000 Retained earnings, January 1 Add net income for year Total Deduct dividends: On preferred stock On common stock Total Retained earnings, December 31 $ 5,000 40,000 $ 45,000 $700,000 $ 5,000 10,000 $ 15,000 $381,000 J L K M N R O Comparative Balance Sheet December 31, 2048 and 2047 Dec. 31, 2048 Dec. 31, 2017 Assets Current assets: Cash Temporary investments Accounts receivable (net) Inventories Prepaid expenses Total current assets Long-term investments Property, plant, and equipment (net) Total assets Liabilities Current liabilities Long-term liabilities: Mortgage note payable, 8%, due in 15 years Bonds payable, 10%, due in 20 years Exercise 5-2 Exercise 5.3 $ 175,000 250,000 190,000 300,000 50,000 $ 965,000 400,000 1,135,000 $2,500,000 $ 200,000 292,000 160,000 260,000 13,000 $ 925,000 100,000 875,000 $1,900,000 $ 200,000 $ 419,000 $ 500,000 750,000 Exercise 56 $ 750,000 relse 5.1 Exercise 5.4 Exercise 5.5 AT 0 Week 5 Assignment - Excel Page Layout Formulas Data Review Normal Calon Bad View Tell me what you want to do... PWrap Text General Merge & Center - $ . % - 12 AA . 000 BTU- Calcula Conditional Format as Neutral Formatting Table Post Migment Number Styles N P R o 400,000 1,135,000 $2,500,000 100,000 875,000 $1,900,000 $ 200,000 $ 419,000 L M Long-term investments Property, plant, and equipment (net) Total assets Liabilities Current liabilities Long-term liabilities: Mortgage note payable, 8%, due in 15 years Bonds payable, 10%, due in 20 years Total long-term liabilities Total liabilities Stockholders' Equity Preferred $5 stock, $100 par Common stock, $5 par Retained earnings Total stockholders' equity Total liabilities and stockholders'equity $ 500,000 750,000 $1,250,000 $1,450,000 $ 750,000 $ 750,000 $1,169,000 $ 100,000 250,000 700,000 $1,050,000 $2,500,000 $ 100,000 250,000 381,000 $ 731,000 $1,900,000
