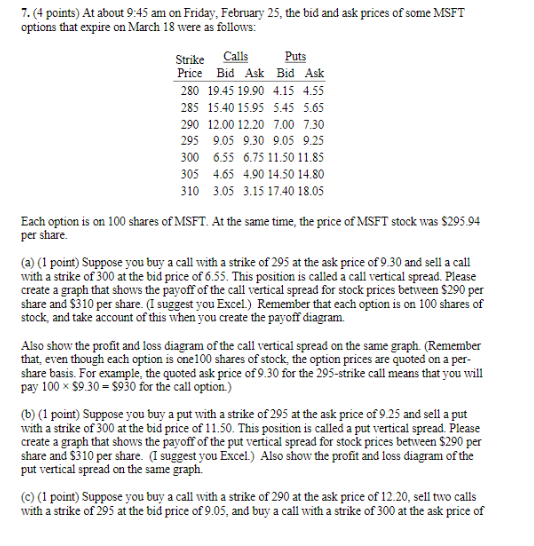
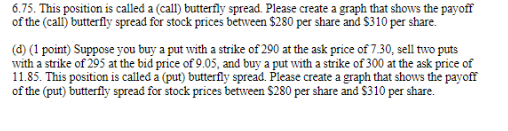
Calls 7. (4 points) At about 9:45 am on Friday, February 25, the bid and ask prices of some MSFT options that expire on March 18 were as follows: Strike Puts Price Bid Ask Bid Ask 280 19.45 19.90 4.15 4.55 285 15.40 15.95 5.45 5.65 290 12.00 12.20 7.00 7.30 295 9.05 9.30 9.05 9.25 300 6.55 6.75 11.50 11.85 305 4.65 4.90 14.50 14.80 310 3.05 3.15 17.40 18.05 Each option is on 100 shares of MSFT. At the same time, the price of MSFT stock was $295.94 per share. (a) (1 point) Suppose you buy a call with a strike of 295 at the ask price of 9.30 and sell a call with a strike of 300 at the bid price of 6.55. This position is called a call vertical spread. Please create a graph that shows the payoff of the call vertical spread for stock prices between $290 per share and $310 per share. (I suggest you Excel.) Remember that each option is on 100 shares of stock, and take account of this when you create the payoff diagram. Also show the profit and loss diagram of the call vertical spread on the same graph. (Remember that even though each option is one 100 shares of stock the option prices are quoted on a per- share basis. For example, the quoted ask price of 9.30 for the 295-strike call means that you will pay 100 x $9.30 = 5930 for the call option.) (b) (1 point) Suppose you buy a put with a strike of 295 at the ask price of 9.25 and sell a put with a strike of 300 at the bid price of 11.50. This position is called a put vertical spread. Please create a graph that shows the payoff of the put vertical spread for stock prices between $290 per share and $310 per share. I suggest you Excel) Also show the profit and loss diagram of the put vertical spread on the same graph. ) (1 point) Suppose you buy a call with a strike of 290 at the ask price of 12.20, sell two calls with a strike of 295 at the bid price of 9.05, and buy a call with a strike of 300 at the ask price of 6.75. This position is called a call) butterfly spread. Please create a graph that shows the payoff of the call) butterfly spread for stock prices between $280 per share and $310 per share. d) (1 point) Suppose you buy a put with a strike of 290 at the ask price of 7.30, sell two puts with a strike of 295 at the bid price of 9.05, and buy a put with a strike of 300 at the ask price of 11.85. This position is called a (put) butterfly spread. Please create a graph that shows the payoff of the (put) butterfly spread for stock prices between $280 per share and $310 per share. Calls 7. (4 points) At about 9:45 am on Friday, February 25, the bid and ask prices of some MSFT options that expire on March 18 were as follows: Strike Puts Price Bid Ask Bid Ask 280 19.45 19.90 4.15 4.55 285 15.40 15.95 5.45 5.65 290 12.00 12.20 7.00 7.30 295 9.05 9.30 9.05 9.25 300 6.55 6.75 11.50 11.85 305 4.65 4.90 14.50 14.80 310 3.05 3.15 17.40 18.05 Each option is on 100 shares of MSFT. At the same time, the price of MSFT stock was $295.94 per share. (a) (1 point) Suppose you buy a call with a strike of 295 at the ask price of 9.30 and sell a call with a strike of 300 at the bid price of 6.55. This position is called a call vertical spread. Please create a graph that shows the payoff of the call vertical spread for stock prices between $290 per share and $310 per share. (I suggest you Excel.) Remember that each option is on 100 shares of stock, and take account of this when you create the payoff diagram. Also show the profit and loss diagram of the call vertical spread on the same graph. (Remember that even though each option is one 100 shares of stock the option prices are quoted on a per- share basis. For example, the quoted ask price of 9.30 for the 295-strike call means that you will pay 100 x $9.30 = 5930 for the call option.) (b) (1 point) Suppose you buy a put with a strike of 295 at the ask price of 9.25 and sell a put with a strike of 300 at the bid price of 11.50. This position is called a put vertical spread. Please create a graph that shows the payoff of the put vertical spread for stock prices between $290 per share and $310 per share. I suggest you Excel) Also show the profit and loss diagram of the put vertical spread on the same graph. ) (1 point) Suppose you buy a call with a strike of 290 at the ask price of 12.20, sell two calls with a strike of 295 at the bid price of 9.05, and buy a call with a strike of 300 at the ask price of 6.75. This position is called a call) butterfly spread. Please create a graph that shows the payoff of the call) butterfly spread for stock prices between $280 per share and $310 per share. d) (1 point) Suppose you buy a put with a strike of 290 at the ask price of 7.30, sell two puts with a strike of 295 at the bid price of 9.05, and buy a put with a strike of 300 at the ask price of 11.85. This position is called a (put) butterfly spread. Please create a graph that shows the payoff of the (put) butterfly spread for stock prices between $280 per share and $310 per share