Answered step by step
Verified Expert Solution
Question
1 Approved Answer
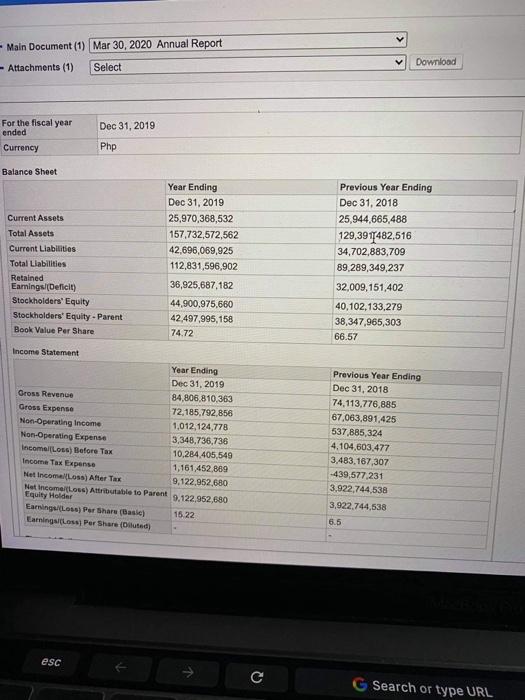
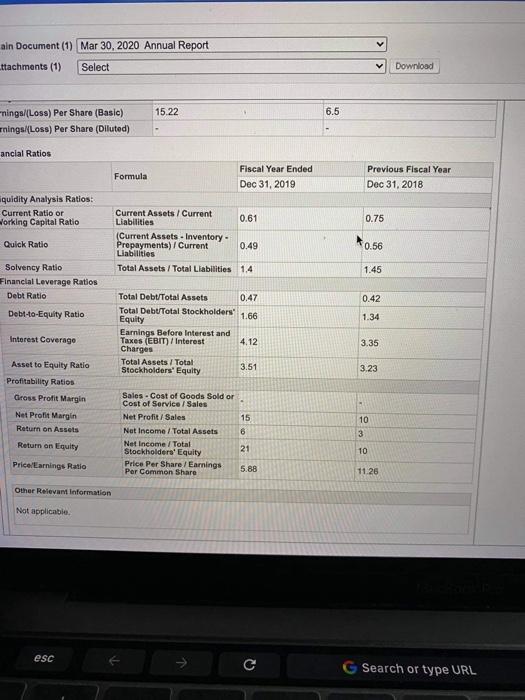
Can anyone due a financial ratio for 2019 using the folllowing given the companys overall financial ration - Main Document (1) Mar 30, 2020 Annual
Can anyone due a financial ratio for 2019 using the folllowing given 


the companys overall financial ration
- Main Document (1) Mar 30, 2020 Annual Report - Attachments (1) Select Download Dec 31, 2019 For the fiscal year ended Currency Php Balance Sheet Current Assets Total Assets Current Liabilities Total Liabilities Retained Earnings (Deficit) Stockholders' Equity Stockholders' Equity - Parent Book Value Per Share Year Ending Dec 31, 2019 25,970,368,532 157.732,572,562 42,696,069,925 112,831,596,902 36,925,687,182 44.900.975,660 42,497,995,158 74.72 Previous Year Ending Dec 31, 2018 25,944,665,488 129,3917482,516 34,702,883,709 89,289,349,237 32,009,151,402 40,102,133,279 38,347,965,303 66.57 Income Statement Year Ending Dec 31, 2019 Gross Revence 84,806,810.363 Gross Expense 72,185,792,856 Non-Operating Income 1,012,124,778 Non-Operating Expense 3,348,736,736 Incomel Loss Before Tax 10,284,405,549 Income Tax Expense 1,161,452,869 Net Income (Loss) After Tax 9,122,952,680 Net Income foss) Attributable to Parent Equity Helder 9,122,962,680 Earning Los) Per Share (Basic) 15 22 Earningatloss Per Share (Duted Previous Year Ending Dec 31, 2018 74,113,776.885 67,063,891,425 537,885,324 4.104,603,477 3,483,167,307 -439,577,231 3,922,744,538 3,922.744,538 esc G Search or type URL ain Document (1) Mar 30, 2020 Annual Report ttachments (1) Select Download 15.22 6.5 ninga/Loss) Per Share (Basic) nings/(Loss) Per Share (Diluted) ancial Ratios Formula Fiscal Year Ended Dec 31, 2019 Previous Fiscal Year Dec 31, 2018 quidity Analysis Ratios: Current Ratio or Working Capital Ratio 0.75 Quick Ratio Current Assets / Current 0.61 Liabilities (Current Assets - Inventory. Prepayments) / Current 0.49 Liabilities Total Assets/Total Liabilities 1.4 0.56 1.45 Solvency Ratio Financial Leverage Ratios Debt Ratio 0.42 Debt-to-Equity Ratio 1.34 Interest Coverago Total Debt/Total Assets 0.47 Total Debt/Total Stockholders 1.66 Equity Earnings Before Interest and Taxes (EBIT) / Interest 4.12 Charges Total Assets/Total Stockholders' Equity 3.51 3.35 3.23 Asset to Equity Ratio Profitability Ratios Gross Profit Margin Net Profit Margin Return on Assets 10 Sales - Cost of Goods Sold or Cost of Service / Sales Net Profit/Sales 15 Not Income / Total Assets 6 Net Income / Total 21 Stockholders' Equity Price Per Share / Earnings Per Common Share 5.88 3 Return on Equity 10 Price Earnings Ratio 11.26 Other Relevant information Not applicable esc G Search or type URL - Main Document (1) Mar 30, 2020 Annual Report - Attachments (1) Select Download Dec 31, 2019 For the fiscal year ended Currency Php Balance Sheet Current Assets Total Assets Current Liabilities Total Liabilities Retained Earnings (Deficit) Stockholders' Equity Stockholders' Equity - Parent Book Value Per Share Year Ending Dec 31, 2019 25,970,368,532 157.732,572,562 42,696,069,925 112,831,596,902 36,925,687,182 44.900.975,660 42,497,995,158 74.72 Previous Year Ending Dec 31, 2018 25,944,665,488 129,3917482,516 34,702,883,709 89,289,349,237 32,009,151,402 40,102,133,279 38,347,965,303 66.57 Income Statement Year Ending Dec 31, 2019 Gross Revence 84,806,810.363 Gross Expense 72,185,792,856 Non-Operating Income 1,012,124,778 Non-Operating Expense 3,348,736,736 Incomel Loss Before Tax 10,284,405,549 Income Tax Expense 1,161,452,869 Net Income (Loss) After Tax 9,122,952,680 Net Income foss) Attributable to Parent Equity Helder 9,122,962,680 Earning Los) Per Share (Basic) 15 22 Earningatloss Per Share (Duted Previous Year Ending Dec 31, 2018 74,113,776.885 67,063,891,425 537,885,324 4.104,603,477 3,483,167,307 -439,577,231 3,922,744,538 3,922.744,538 esc G Search or type URL ain Document (1) Mar 30, 2020 Annual Report ttachments (1) Select Download 15.22 6.5 ninga/Loss) Per Share (Basic) nings/(Loss) Per Share (Diluted) ancial Ratios Formula Fiscal Year Ended Dec 31, 2019 Previous Fiscal Year Dec 31, 2018 quidity Analysis Ratios: Current Ratio or Working Capital Ratio 0.75 Quick Ratio Current Assets / Current 0.61 Liabilities (Current Assets - Inventory. Prepayments) / Current 0.49 Liabilities Total Assets/Total Liabilities 1.4 0.56 1.45 Solvency Ratio Financial Leverage Ratios Debt Ratio 0.42 Debt-to-Equity Ratio 1.34 Interest Coverago Total Debt/Total Assets 0.47 Total Debt/Total Stockholders 1.66 Equity Earnings Before Interest and Taxes (EBIT) / Interest 4.12 Charges Total Assets/Total Stockholders' Equity 3.51 3.35 3.23 Asset to Equity Ratio Profitability Ratios Gross Profit Margin Net Profit Margin Return on Assets 10 Sales - Cost of Goods Sold or Cost of Service / Sales Net Profit/Sales 15 Not Income / Total Assets 6 Net Income / Total 21 Stockholders' Equity Price Per Share / Earnings Per Common Share 5.88 3 Return on Equity 10 Price Earnings Ratio 11.26 Other Relevant information Not applicable esc G Search or type URL Step by Step Solution
There are 3 Steps involved in it
Step: 1

Get Instant Access to Expert-Tailored Solutions
See step-by-step solutions with expert insights and AI powered tools for academic success
Step: 2

Step: 3

Ace Your Homework with AI
Get the answers you need in no time with our AI-driven, step-by-step assistance
Get Started


