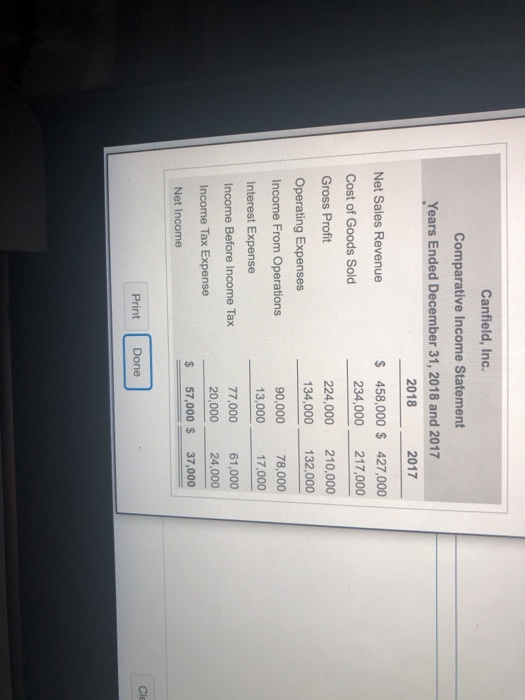
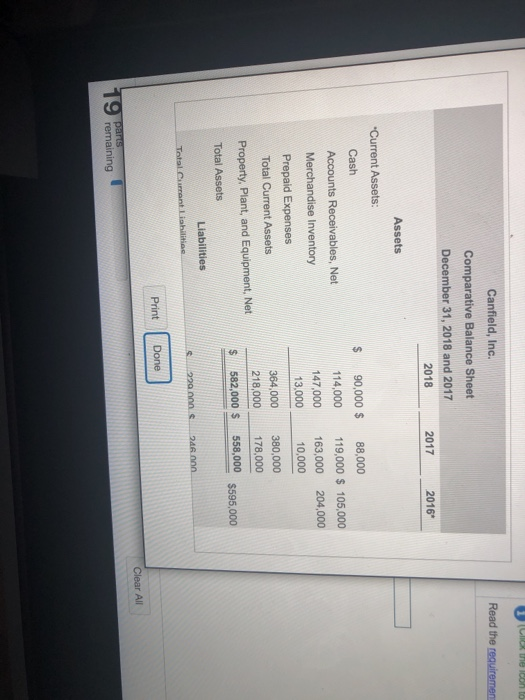
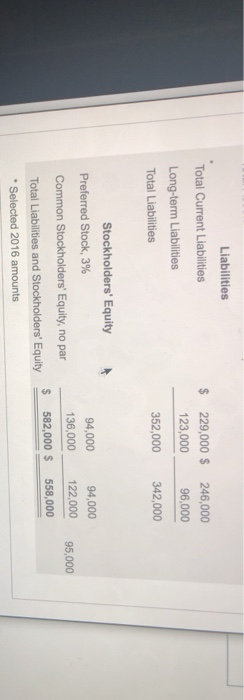
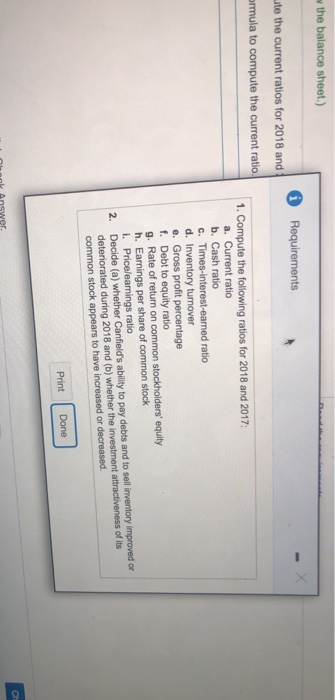
Canfield, Inc. Comparative Income Statement Years Ended December 31, 2018 and 2017 2018 2017 Net Sales Revenue $ 458,000 $ 427,000 Cost of Goods Sold 234,000 217,000 Gross Profit 224,000 210,000 Operating Expenses 134,000 132,000 Income From Operations 90,000 78,000 Interest Expense 13,000 17,000 Income Before Income Tax 77,000 61,000 Income Tax Expense 20,000 24,000 Net Income $ 57,000 $ 37,000 Print Done Canfield, Inc. Comparative Balance Sheet December 31, 2018 and 2017 Read the require 2018 2017 2016 Assets Current Assets: Cash $ Accounts Receivables, Net Merchandise Inventory Prepaid Expenses Total Current Assets Property, Plant, and Equipment, Net 90,000 $ 114,000 147,000 13,000 88,000 119,000 $ 105,000 163,000 204,000 10,000 380,000 178,000 558,000 364,000 218,000 582,000 $ $ Total Assets Liabilities Totalmente $595,000 220 Print Done 19 Peraining Clear All Liabilities Total Current Liabilities Long-term Liabilities Total Liabilities $ 229,000 $ 123,000 352,000 246,000 96,000 342,000 Stockholders' Equity Preferred Stock, 3% Common Stockholders' Equity, no par Total Liabilities and Stockholders' Equity * Selected 2016 amounts 94,000 136,000 582,000 $ 94,000 122.000 558,000 95,000 $ the balance sheet.) 0 Requirements ute the current ratios for 2018 and ermula to compute the current ratio. 1. Compute the following ratios for 2018 and 2017: a. Current ratio b. Cash ratio C. Times-interest-eamed ratio d. Inventory turnover e. Gross profit percentage f. Debt to equity ratio g. Rate of return on common stockholders' equity h. Earnings per share of common stock Pricelearnings ratio Decide (a) whether Canfield's ability to pay debts and to set inventory improved or deteriorated during 2018 and (b) whether the investment attractiveness of its common stock appears to have increased or decreased Print Done