Can I get help with this please. General Instructions: Please place your name above (this needs to be done on any document submitted for the
Can I get help with this please.
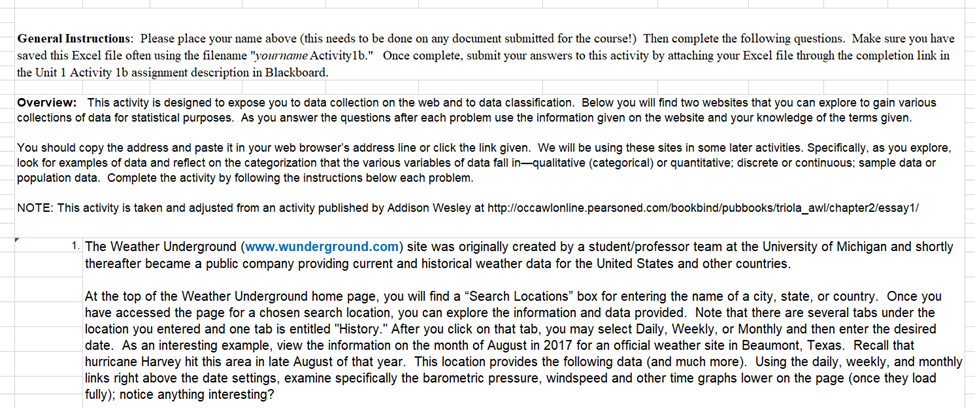
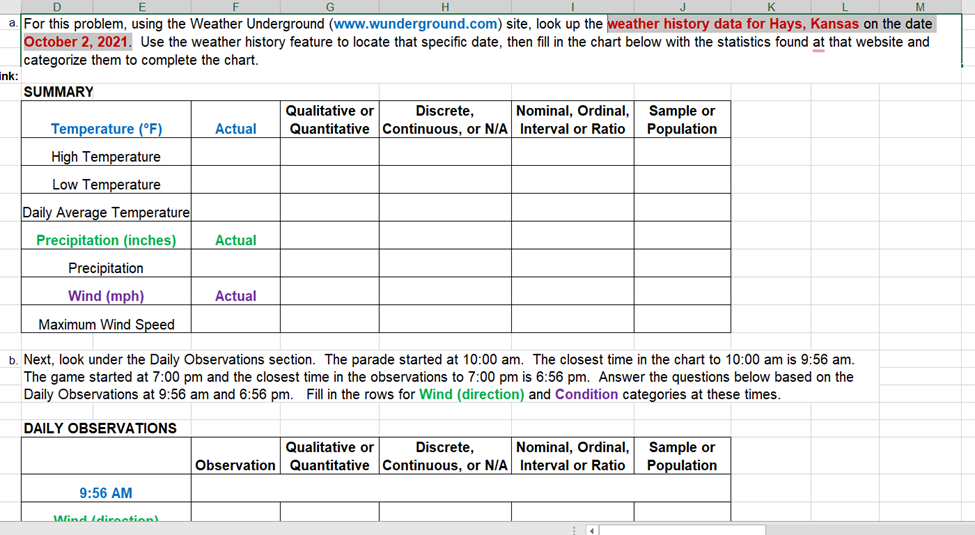
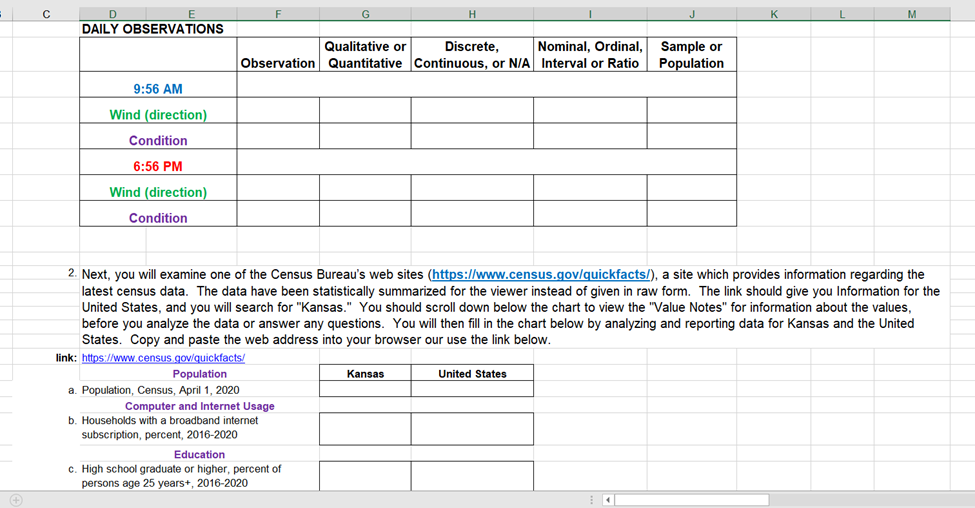
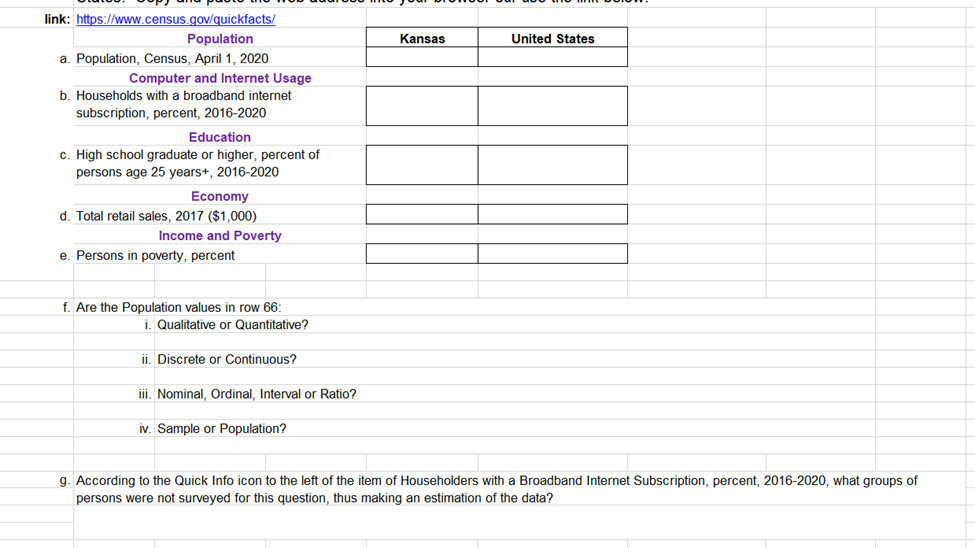
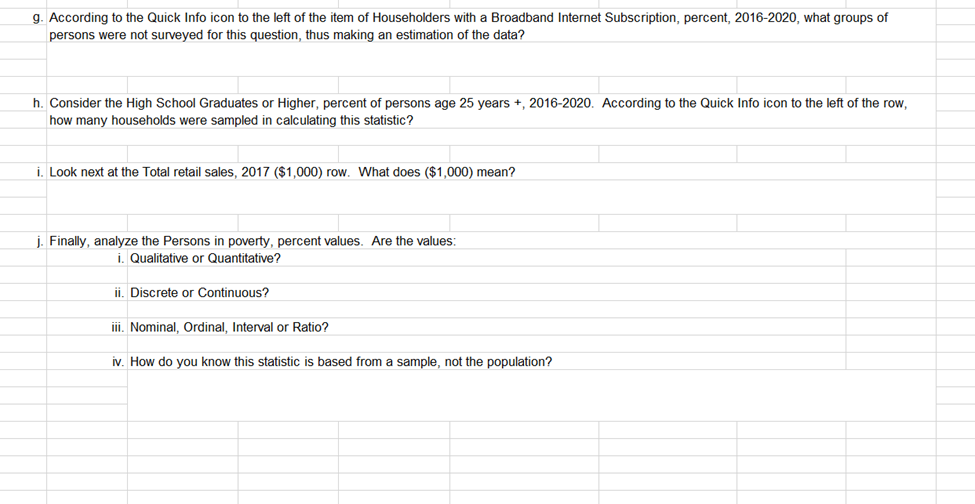
General Instructions: Please place your name above (this needs to be done on any document submitted for the course!) Then complete the following questions. Make sure you have saved this Excel file often using the filename "yowrname Activitylb." Once complete, submit your answers to this activity by attaching your Excel file through the completion link in the Unit 1 Activity 1b assignment description in Blackboard. Overview: This activity is designed to expose you to data collection on the web and to data classification. Below you will find two websites that you can explore to gain various collections of data for statistical purposes. As you answer the questions after each problem use the information given on the website and your knowledge of the terms given. You should copy the address and paste it in your web browser's address line or click the link given. We will be using these sites in some later activities. Specifically, as you explore, look for examples of data and reflect on the categorization that the various variables of data fall inqualitative (categorical) or quantitative; discrete or continuous: sample data or population data. Complete the activity by following the instructions below each problem. NOTE: This activity is taken and adjusted from an activity published by Addison Wesley at hitp./foccawlonline pearsoned.com/bookbind/pubbocksi/tricla_awl/chapter2/essay1/ r 1. The Weather Underground (www.wunderground.com) site was originally created by a student/professor team at the University of Michigan and shortly thereafter became a public company providing current and historical weather data for the United States and other countries. At the top of the Weather Underground home page, you will find a \"Search Locations\" box for entering the name of a city, state, or country. Once you have accessed the page for a chosen search location, you can explore the information and data provided. Note that there are several tabs under the location you entered and one tab is entitled "History.\" After you click on that tab, you may select Daily, Weekly, or Monthly and then enter the desired date. As an interesting example, view the information on the month of August in 2017 for an official weather site in Beaumont, Texas. Recall that hurricane Harvey hit this area in late August of that year. This location provides the following data (and much more). Using the daily, weekly, and monthly links right above the date settings, examine specifically the barometric pressure, windspeed and other time graphs lower on the page (once they load fully); notice anything interesting? J K L M a.|For this problem, using the Weather Underground (www.wunderground.com) site, look up the ther history data for Hays, Kansas on the date October 2, 2021. Use the weather history feature to locate that specific date, then fill in the chart below with the statistics found at that website and categorize them to complete the chart. ink: SUMMARY Qualitative or Discrete, Nominal, Ordinal,| Sample or Temperature (F) Actual Quantitative |Continuous, or N/A| Interval or Ratio | Population High Temperature Low Temperature Daily Average Temperature Precipitation (inches Precipitation Wind (mph) Actual Maximum Wind Speed b. Next, look under the Daily Observations section. The parade started at 10:00 am. The closest time in the chart to 10:00 am is 9:56 am. The game started at 7:00 pm and the closest time in the observations to 7:00 pm is 6:56 pm. Answer the guestions below based on the Daily Observations at 9:56 am and 6:56 pm. Fill in the rows for Wind (direction) and Condition categories at these times. 'DAILY OBSERVATIONS Qualitative or Discrete, Nominal, Ordinal,| Sample or Observation | Quantitative |Continuous, or N/A| Interval or Ratio | Population 9:56 AM AAlisndd L edivanntines) D B E G H 1 J K L M DAILY OBSERVATIONS Qualitative or Discrete, Nominal, Ordinal,| Sample or Observation | Quantitative |Continuous, or N/A| Interval or Ratio | Population Condition 6:56 PM Wind (direction) Condition 2. Next, you will examine one of the Census Bureau's web sites (https://www.census.qgov/quickfacts/), a site which provides information regarding the latest census data. The data have been statistically summarized for the viewer instead of given in raw form. The link should give you Information for the United States, and you will search for "Kansas.\" You should scroll down below the chart to view the "Value Notes" for information about the values, before you analyze the data or answer any questions. You will then fill in the chart below by analyzing and reporting data for Kansas and the United States. Copy and paste the web address into your browser our use the link below. link: hitps /lwww census gov/quickfacts/ Population Kansas | United States Population, Census, April 1, 2020 Computer and Internet Usage Households with a broadband internet subscription, percent, 2016-2020 | Education High school graduate or higher, percent of persons age 25 years+, 2016-2020 = a link: https://www.census.gov/quickfacts/ Population Kansas United States a. Population, Census, April 1, 2020 Computer and Internet Usage b. Households with a broadband internet subscription, percent, 2016-2020 Education c. High school graduate or higher, percent of persons age 25 years+, 2016-2020 Economy d. Total retail sales, 2017 ($1,000) Income and Poverty e. Persons in poverty, percent f. Are the Population values in row 66: i. Qualitative or Quantitative? ii. Discrete or Continuous? iii. Nominal, Ordinal, Interval or Ratio? iv. Sample or Population? 9. According to the Quick Info icon to the left of the item of Householders with a Broadband Internet Subscription, percent, 2016-2020, what groups of persons were not surveyed for this question, thus making an estimation of the data?w - . According to the Quick Info icon to the left of the item of Householders with a Broadband Internet Subscription, percent, 2016-2020, what groups of persons were not surveyed for this question, thus making an estimation of the data? . Consider the High School Graduates or Higher, percent of persons age 25 years +, 2016-2020. According to the Quick Info icon to the left of the row, how many households were sampled in calculating this statistic? Look next at the Total retail sales, 2017 ($1,000) row. What does ($1,000) mean? . Finally, analyze the Persons in poverty, percent values. Are the values: i. Qualitative or Quantitative? ii. Discrete or Continuous? iii. Nominal, Ordinal, Interval or Ratio? iv. How do you know this statistic is based from a sample, not the population
Step by Step Solution
There are 3 Steps involved in it
Step: 1
Get Instant Access to Expert-Tailored Solutions
See step-by-step solutions with expert insights and AI powered tools for academic success
Step: 2
Step: 3
Ace Your Homework with AI
Get the answers you need in no time with our AI-driven, step-by-step assistance