Answered step by step
Verified Expert Solution
Link Copied!

Question

1 Approved Answer

Can my tutor please answer the following questions and explain them. Follow the directions and explain and answer the questions. Tech Company Employees Construct a

Can my tutor please answer the following questions and explain them.

Follow the directions and explain and answer the questions.

image text in transcribedimage text in transcribedimage text in transcribedimage text in transcribed
Tech Company Employees Construct a vertical and horizontal bar graph for the number of employees (in thousands) of a sample of the largest tech companies as of 2014. Company Employees IBM 380 Hewlett Packard 302 Xerox 147 Microsoft 128 Intel 102 3. Gulf Coastlines Construct a Pareto chart for the sizes of Gulf coastlines in statute miles for each state. State Coastline Alabama 53 Florida 770 Louisiana 397 Mississippi 44 367 Texas Pg. 10Air Pollution One of the air pollutants that is measured in selected cities is sulfur dioxide. This pollutant occurs when fossil fuels are burned. This pollutant is measured in micrograms per cubic meter (g/m'). The results obtained from a sample of 24 cities are shown in the frequency distributions. One sample was taken recently, and the other sample of the same cities was taken 5 years ago. Construct a histogram and compare the two distributions. 67 Class limits Frequency (now) Frequency 5 years ago) 10-14 15-19 20-24 25-29 30-34 -NOWNA 35-39 10-44 45-49 1 Total 24 Total 24Tech Company Employees Construct a vertical and horizontal bar graph for the number of employees (in thousands) of a sample of the largest tech companies as of 2014. Company Employees IBM 380 Hewlett Packard 302 Xerox 147 Microsoft 128 Intel 102 3. Gulf Coastlines Construct a Pareto chart for the sizes of Gulf coastlines in statute miles for each state. State Coastline Alabama 53 Florida 770 Louisiana 397 Mississippi 44 367 Texas Pg. 10and comment on the trend. Online Ad Spending The amount spent (in billions of dollars) for ads online is shown (The numbers for 2016 through 2019 are projected numbers.) Draw a time series graph Year 2014 2015 2016 2017 2018 2019 Amount $19.72 $31.53 $43.83 $53.29 $61.14 $69.04 9. Credit Cards Draw and analyze a pie graph for the number of credit cards a person has. 4 or more Number of cards 2 or 3 Number 52 40 68 40 pg. 12

Step by Step Solution

There are 3 Steps involved in it

Step: 1

blur-text-image

Get Instant Access to Expert-Tailored Solutions

See step-by-step solutions with expert insights and AI powered tools for academic success

Step: 2

blur-text-image

Step: 3

blur-text-image

Ace Your Homework with AI

Get the answers you need in no time with our AI-driven, step-by-step assistance

Get Started

Recommended Textbook for

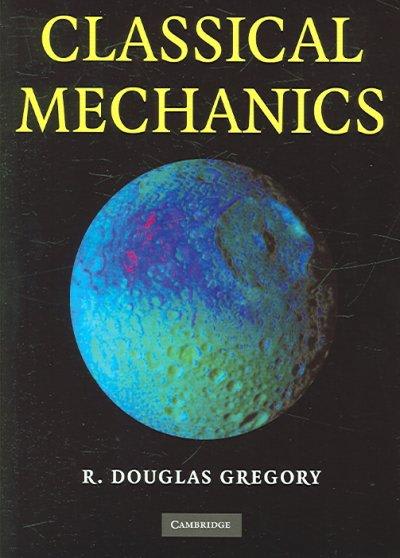
Classical Mechanics

Authors: R Douglas Gregory

1st Edition

0511159242, 9780511159244

More Books

Students also viewed these Mathematics questions

Question

Define promotion.

Answered: 1 week ago

Question

Write a note on transfer policy.

Answered: 1 week ago

Question

Discuss about training and development in India?

Answered: 1 week ago

Question

Explain the various techniques of training and development.

Answered: 1 week ago