

Answered step by step
Verified Expert Solution
Question
1 Approved Answer
Can some review question #3 on Capital Budgeting tab for accuracy. if it is not correct please help. Feedback is in blue. Thanks for your
Can some review question #3 on Capital Budgeting tab for accuracy. if it is not correct please help. Feedback is in blue. Thanks for your help.
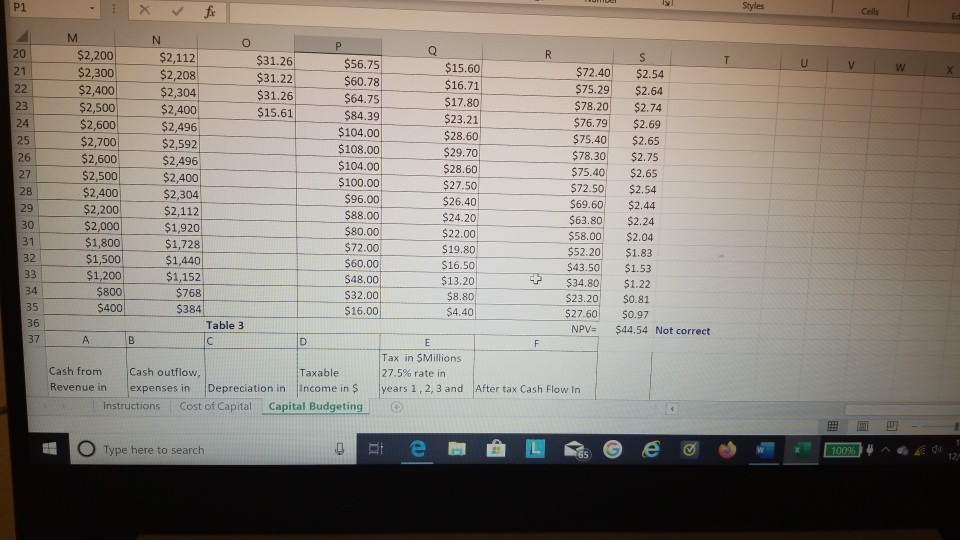
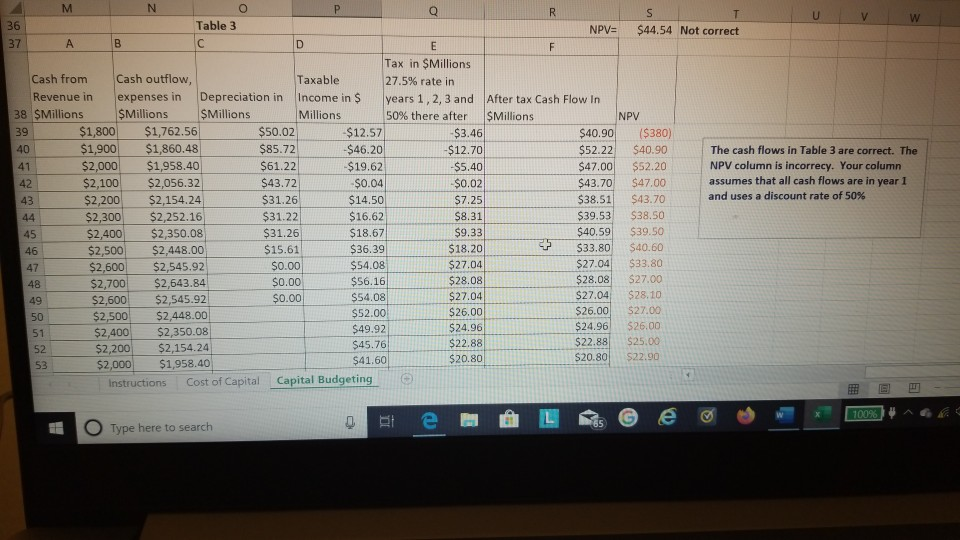
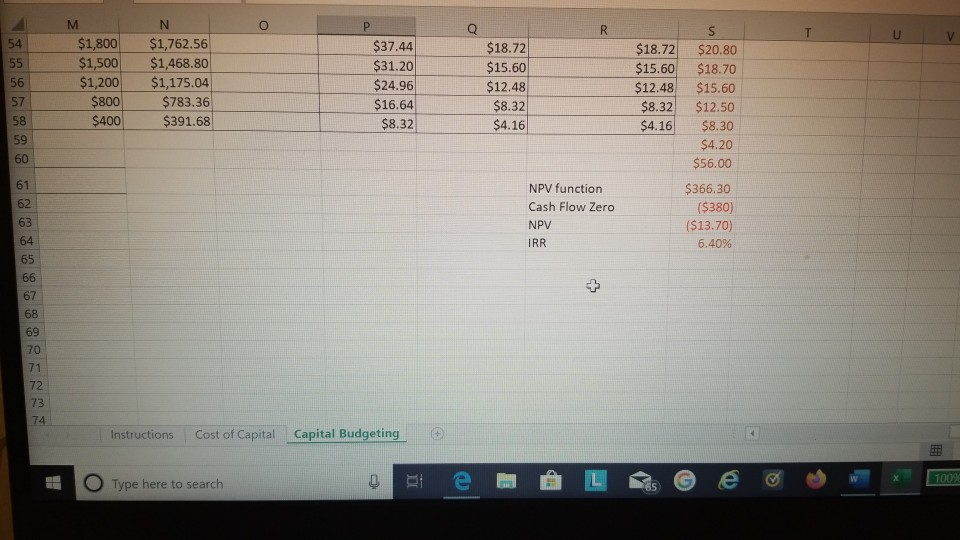
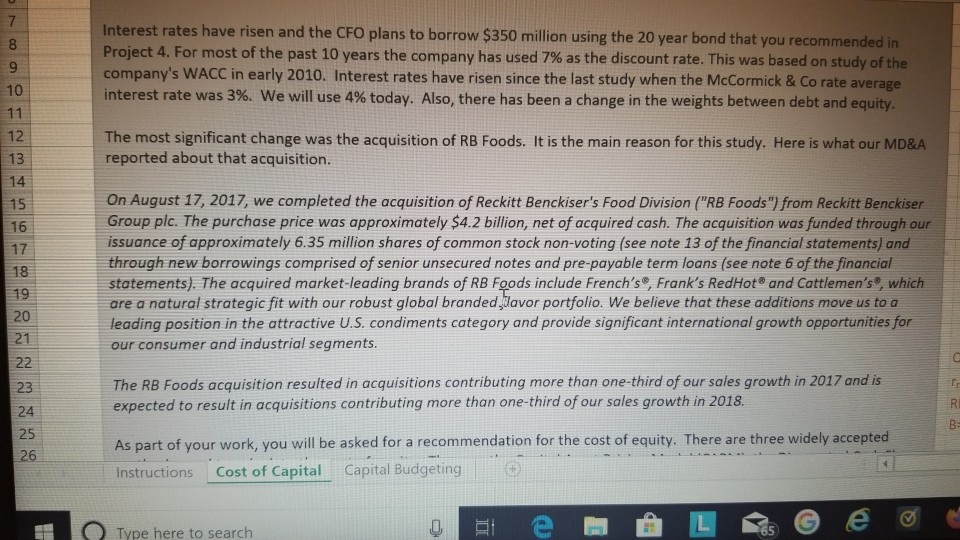
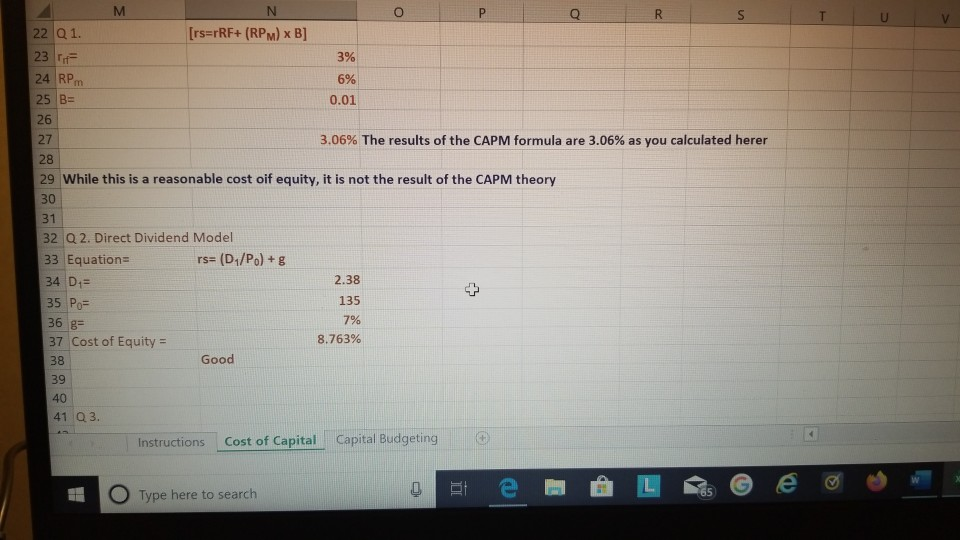
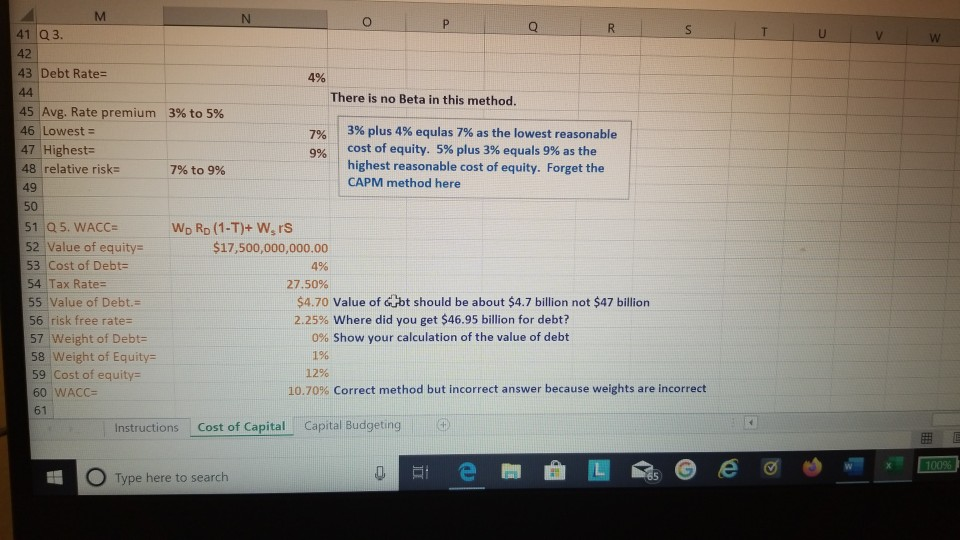
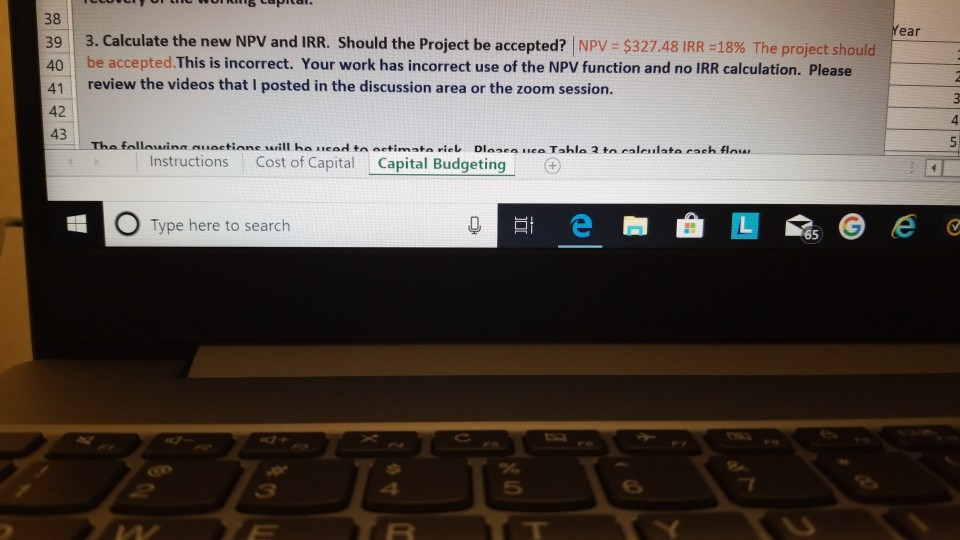
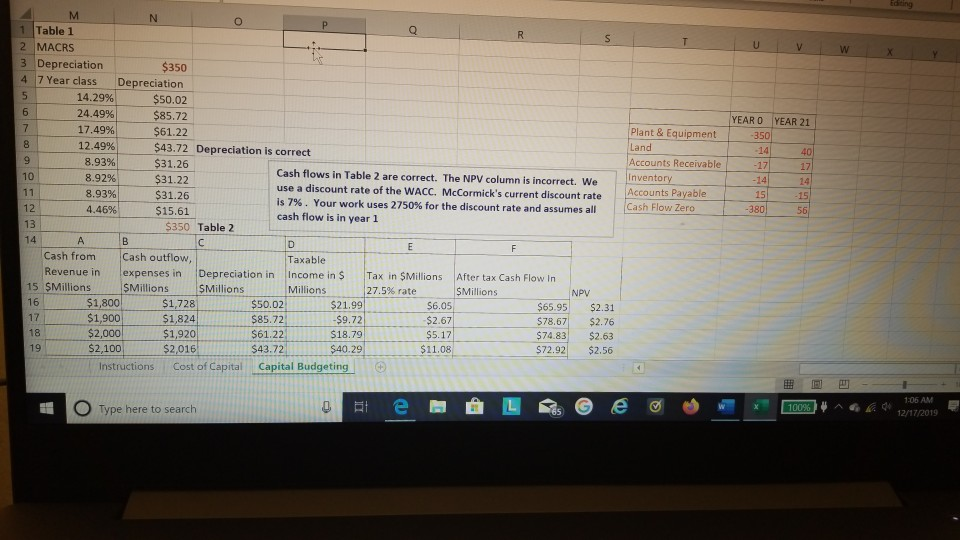
Interest rates have risen and the CFO plans to borrow $350 million using the 20 year bond that you recommended in Project 4. For most of the past 10 years the company has used 7% as the discount rate. This was based on study of the company's WACC in early 2010. Interest rates have risen since the last study when the McCormick & Co rate average interest rate was 3%. We will use 4% today. Also, there has been a change in the weights between debt and equity. The most significant change was the acquisition of RB Foods. It is the main reason for this study. Here is what our MD&A reported about that acquisition. On August 17, 2017, we completed the acquisition of Reckitt Benckiser's Food Division ("RB Foods") from Reckitt Benckiser Group pic. The purchase price was approximately $4.2 billion, net of acquired cash. The acquisition was funded through our issuance of approximately 6.35 million shares of common stock non-voting (see note 13 of the financial statements) and through new borrowings comprised of senior unsecured notes and pre-payable term loans (see note 6 of the financial statements). The acquired market-leading brands of RB Foods include French's, Frank's Red Hot and Cattlemen's, which are a natural strategic fit with our robust global branded davor portfolio. We believe that these additions move us to a leading position in the attractive U.S. condiments category and provide significant international growth opportunities for our consumer and industrial segments. - The RB Foods acquisition resulted in acquisitions contributing more than one-third of our sales growth in 2017 and is expected to result in acquisitions contributing more than one-third of our sales growth in 2018. As part of your work, you will be asked for a recommendation for the cost of equity. There are three widely accepted Instructions Cost of Capital Capital Budgeting O Type here to search [rs=rRF+ (RPM) x B] 3% 22 01. 23 24 RPM 25 B= 6% 0.01 3.06% The results of the CAPM formula are 3.06% as you calculated herer 29 While this is a reasonable cost oif equity, it is not the result of the CAPM theory 30 31 32 Q 2. Direct Dividend Model 33 Equations rs= (D/P.) +g 34 D = 35 Po= 36 g= 37 Cost of Equity = 2.38 135 7% 8.763% 38 Good 41 Q3. Instructions Cost of Capital Capital Budgeting O Type here to search O P Q 41 Q3 R S Tu v w. 4% 43 Debt Rate= 44 There is no Beta in this method. 45 Avg. Rate premium 3% to 5% 46 Lowest = 7% 3% plus 4% equlas 7% as the lowest reasonable 47 Highest 9% cost of equity. 5% plus 3% equals 9% as the 48 relative risk= 7% to 9% highest reasonable cost of equity. Forget the 49 CAPM method here 50 51 Q 5. WACC= Wo Rp (1-T)+ Wers 52 Value of equity= $17,500,000,000.00 53 Cost of Debt 4% 54 Tax Rate= 27.50% 55 Value of Debt. $4.70 Value of Gubt should be about $4.7 billion not $47 billion 56 risk free rate= 2.25% Where did you get $46.95 billion for debt? 57 Weight of Debt= 0% Show your calculation of the value of debt 58 Weight of Equity= 1% 59 Cost of equity= 12% 60 WACC 10.70% Correct method but incorrect answer because weights are incorrect 61 Instructions Cost of Capital Capital Budgeting 100% O Type here to search Year 40 41 3. Calculate the new NPV and IRR. Should the Project be accepted? NPV = $327.48 IRR =18% The project should be accepted. This is incorrect. Your work has incorrect use of the NPV function and no IRR calculation. Please review the videos that I posted in the discussion area or the zoom session. The following usetinne will ha read to netimata viel Dasca lica Tohle 2 to calculata rach flow Instructions Cost of Capital Capital Budgeting O Type here to search et e 6 LB e a YEAR O YEAR 21 350 M 1 Table 1 2 MACRS 3 Depreciation $350 4 7 Year class Depreciation 14.29% $50.02 24.49% $85.72 17.49% $61.22 12.49% $43.72 Depreciation is correct 8.93% $31.26 8.92% Cash flows in Table 2 are correct. The NPV column is incorrect. We $31.22 use a discount rate of the WACC. McCormick's current discount rate 8.93% $31.26 is 7%. Your work uses 2750% for the discount rate and assumes all 4.46% $15.61 cash flow is in year 1 $350 Table 2 A Cash from Cash outflow, Taxable Revenue in expenses in Depreciation in Income in $ Tax in SMillions After tax Cash Flow In 15 $Millions $Millions SMillions Millions 27.5% rate SMillions NPY 16 $1,800 $1,728 $50.02 $21.99 $6.05 $65.95 $2.31 17 $1,900 $1,824 $85.72 $9.72 $2.67 $78.67 $2.76 18 $2,000 $1,920 $61.22 $18.79 $5.17 $74.83 $2.63 19 $2,100 $2,016 $43.72 $40.29 $11.08 $72.92 $2.56 Instructions Cost of Capital Capital Budgeting Plant & Equipment Land Accounts Receivable Inventory Accounts Payable Cash Flow Zero - 17 -- 4 O 1009) * ^6 Type here to search 1:06 AM 12/17/2019 Styles T U V W X $31.26 $31.22 $31.26 $15.61 $2,200 $2,300 $2,400 $2,500 $2,600 $2,700 $2,600 $2,500 $2,400 $2,200 $2,000 $1,800 $1,500 $1,200 $800 $400 N o $2,112 $2,208 $2,304 $2,400 $2,496 $2,592 $2,496 $2,400 $2,304 $2,112 $1,920 $1,728 $1,440 $1,152 $768 $384 Table 3 $56.75 $60.78 $64.75 $84.39 $104.00 $108.00 $104.00 $100.00 $96.00 $88.00 $80.00 $72.00 $60.00 $48.00 $32.00 $16.00 $15.60 $16.71 $17.80 $23.21 $28.60 $29.70 $28.60 $27.50 $26.40 $24.20 $22.00 $19.80 $16.50 $13.20 $8.80 $4.40 $72.40 $75.29 $78.20 $76.79 $75.40 $78.30 $75.40 $72.50 $69.60 $63.80 $58.00 $52.20 $43.50 $34.80 $23.20 $27.60 NPV= $2.54 $2.64 $2.74 $2.69 $2.65 $2.75 $2.65 $2.54 $2.44 $2.24 $2.04 $1.83 $1.53 $1.22 $0.81 $0.97 $44.54 Not correct + Cash from Cash outflow, Taxable Revenue in expenses in Depreciation in Income in $ Instructions Cost of Capital Capital Budgeting Tax in SMillions 27.5% rate in years 1,2,3 and After tax Cash Flow In O Type here to search B e M Las e o 100%) ^ 2 Q VW $44.54 Not correct MN Table 3 NPV= 13 AB IC Tax in Millions Cash from Cash outflow, Taxable 27.5% rate in Revenue in expenses in Depreciation in Income in $ years 1, 2, 3 and After tax Cash Flow In 38 Millions $Millions SMillions Millions 50% there after Millions $1,800 $1,762.56 $50.02 $12.57 $3.46 $40.90 40 $1,900 $1,860.48 $85.72 $46.20 $12.70 $52.22 $2,000 $1,958.40 $61.22 $19.62 -$5.40 $47.00 $2,100 $2,056.32 $43.72 $0.04 $0.02 $43.70 $2,200 $2,154.24 $31.26 $14.50 $7.25 $38.51 $2,300 $2,252.16 $31.22 $16.62 $8.31 $39.53 $2,400 $2,350.08 $31.26 $18.67 $9.33 $40.59 $2,500 $2,448.00 $15.61 $36.39 $18.20 $33.80 $2,600 $2,545.92 $0.00 $54.08 $27.04 $27.04 $2,700 $2,643.84 $0.00 $56.16 $28.08 $28.08 49 $2,600 $2,545.92 $0.00 $54.08 $27.04 $27.04 $2,500 $2,448.00 $52.00 $26.00 $26.00 51 $2,400 $2,350.08 $49.92 $24.96 $24.96 52 $22.88 $2,200 $45.76 $2,154.24 $22.88 $2,000 $1,958.40 $41.60 $20.80 $20.80 Instructions Cost of Capital Capital Budgeting The cash flows in Table 3 are correct. The NPV column is incorrecy. Your column assumes that all cash flows are in year 1 and uses a discount rate of 50% ($380) $40.90 $52.20 $47.00 $43.70 $38.50 $39.50 $40.60 $33.80 $27.00 $28.10 $27.00 $26.00 $25.00 $22.90 100%) AGO Type here to search NO $1,800 $1,762.56 $1,500 $1,468.80 $1,200 $1,175.04 $800 $783.36 $400 $391.68 $37.44 $31.20 $24.96 $16.64 $18.72 $15.60 $12.48 $8.32 $4.16 $18.72 $15.60 $12.48 $8.32 $4.16 $8.32 S $20.80 $18.70 $15.60 $12.50 $8.30 $4.20 $56.00 $366.30 ($380) ($13.70) 6.40% NPV function Cash Flow Zero NPV IRR Instructions Cost of Capital Capital Budgeting 1009 Type here to search Interest rates have risen and the CFO plans to borrow $350 million using the 20 year bond that you recommended in Project 4. For most of the past 10 years the company has used 7% as the discount rate. This was based on study of the company's WACC in early 2010. Interest rates have risen since the last study when the McCormick & Co rate average interest rate was 3%. We will use 4% today. Also, there has been a change in the weights between debt and equity. The most significant change was the acquisition of RB Foods. It is the main reason for this study. Here is what our MD&A reported about that acquisition. On August 17, 2017, we completed the acquisition of Reckitt Benckiser's Food Division ("RB Foods") from Reckitt Benckiser Group pic. The purchase price was approximately $4.2 billion, net of acquired cash. The acquisition was funded through our issuance of approximately 6.35 million shares of common stock non-voting (see note 13 of the financial statements) and through new borrowings comprised of senior unsecured notes and pre-payable term loans (see note 6 of the financial statements). The acquired market-leading brands of RB Foods include French's, Frank's Red Hot and Cattlemen's, which are a natural strategic fit with our robust global branded davor portfolio. We believe that these additions move us to a leading position in the attractive U.S. condiments category and provide significant international growth opportunities for our consumer and industrial segments. - The RB Foods acquisition resulted in acquisitions contributing more than one-third of our sales growth in 2017 and is expected to result in acquisitions contributing more than one-third of our sales growth in 2018. As part of your work, you will be asked for a recommendation for the cost of equity. There are three widely accepted Instructions Cost of Capital Capital Budgeting O Type here to search [rs=rRF+ (RPM) x B] 3% 22 01. 23 24 RPM 25 B= 6% 0.01 3.06% The results of the CAPM formula are 3.06% as you calculated herer 29 While this is a reasonable cost oif equity, it is not the result of the CAPM theory 30 31 32 Q 2. Direct Dividend Model 33 Equations rs= (D/P.) +g 34 D = 35 Po= 36 g= 37 Cost of Equity = 2.38 135 7% 8.763% 38 Good 41 Q3. Instructions Cost of Capital Capital Budgeting O Type here to search O P Q 41 Q3 R S Tu v w. 4% 43 Debt Rate= 44 There is no Beta in this method. 45 Avg. Rate premium 3% to 5% 46 Lowest = 7% 3% plus 4% equlas 7% as the lowest reasonable 47 Highest 9% cost of equity. 5% plus 3% equals 9% as the 48 relative risk= 7% to 9% highest reasonable cost of equity. Forget the 49 CAPM method here 50 51 Q 5. WACC= Wo Rp (1-T)+ Wers 52 Value of equity= $17,500,000,000.00 53 Cost of Debt 4% 54 Tax Rate= 27.50% 55 Value of Debt. $4.70 Value of Gubt should be about $4.7 billion not $47 billion 56 risk free rate= 2.25% Where did you get $46.95 billion for debt? 57 Weight of Debt= 0% Show your calculation of the value of debt 58 Weight of Equity= 1% 59 Cost of equity= 12% 60 WACC 10.70% Correct method but incorrect answer because weights are incorrect 61 Instructions Cost of Capital Capital Budgeting 100% O Type here to search Year 40 41 3. Calculate the new NPV and IRR. Should the Project be accepted? NPV = $327.48 IRR =18% The project should be accepted. This is incorrect. Your work has incorrect use of the NPV function and no IRR calculation. Please review the videos that I posted in the discussion area or the zoom session. The following usetinne will ha read to netimata viel Dasca lica Tohle 2 to calculata rach flow Instructions Cost of Capital Capital Budgeting O Type here to search et e 6 LB e a YEAR O YEAR 21 350 M 1 Table 1 2 MACRS 3 Depreciation $350 4 7 Year class Depreciation 14.29% $50.02 24.49% $85.72 17.49% $61.22 12.49% $43.72 Depreciation is correct 8.93% $31.26 8.92% Cash flows in Table 2 are correct. The NPV column is incorrect. We $31.22 use a discount rate of the WACC. McCormick's current discount rate 8.93% $31.26 is 7%. Your work uses 2750% for the discount rate and assumes all 4.46% $15.61 cash flow is in year 1 $350 Table 2 A Cash from Cash outflow, Taxable Revenue in expenses in Depreciation in Income in $ Tax in SMillions After tax Cash Flow In 15 $Millions $Millions SMillions Millions 27.5% rate SMillions NPY 16 $1,800 $1,728 $50.02 $21.99 $6.05 $65.95 $2.31 17 $1,900 $1,824 $85.72 $9.72 $2.67 $78.67 $2.76 18 $2,000 $1,920 $61.22 $18.79 $5.17 $74.83 $2.63 19 $2,100 $2,016 $43.72 $40.29 $11.08 $72.92 $2.56 Instructions Cost of Capital Capital Budgeting Plant & Equipment Land Accounts Receivable Inventory Accounts Payable Cash Flow Zero - 17 -- 4 O 1009) * ^6 Type here to search 1:06 AM 12/17/2019 Styles T U V W X $31.26 $31.22 $31.26 $15.61 $2,200 $2,300 $2,400 $2,500 $2,600 $2,700 $2,600 $2,500 $2,400 $2,200 $2,000 $1,800 $1,500 $1,200 $800 $400 N o $2,112 $2,208 $2,304 $2,400 $2,496 $2,592 $2,496 $2,400 $2,304 $2,112 $1,920 $1,728 $1,440 $1,152 $768 $384 Table 3 $56.75 $60.78 $64.75 $84.39 $104.00 $108.00 $104.00 $100.00 $96.00 $88.00 $80.00 $72.00 $60.00 $48.00 $32.00 $16.00 $15.60 $16.71 $17.80 $23.21 $28.60 $29.70 $28.60 $27.50 $26.40 $24.20 $22.00 $19.80 $16.50 $13.20 $8.80 $4.40 $72.40 $75.29 $78.20 $76.79 $75.40 $78.30 $75.40 $72.50 $69.60 $63.80 $58.00 $52.20 $43.50 $34.80 $23.20 $27.60 NPV= $2.54 $2.64 $2.74 $2.69 $2.65 $2.75 $2.65 $2.54 $2.44 $2.24 $2.04 $1.83 $1.53 $1.22 $0.81 $0.97 $44.54 Not correct + Cash from Cash outflow, Taxable Revenue in expenses in Depreciation in Income in $ Instructions Cost of Capital Capital Budgeting Tax in SMillions 27.5% rate in years 1,2,3 and After tax Cash Flow In O Type here to search B e M Las e o 100%) ^ 2 Q VW $44.54 Not correct MN Table 3 NPV= 13 AB IC Tax in Millions Cash from Cash outflow, Taxable 27.5% rate in Revenue in expenses in Depreciation in Income in $ years 1, 2, 3 and After tax Cash Flow In 38 Millions $Millions SMillions Millions 50% there after Millions $1,800 $1,762.56 $50.02 $12.57 $3.46 $40.90 40 $1,900 $1,860.48 $85.72 $46.20 $12.70 $52.22 $2,000 $1,958.40 $61.22 $19.62 -$5.40 $47.00 $2,100 $2,056.32 $43.72 $0.04 $0.02 $43.70 $2,200 $2,154.24 $31.26 $14.50 $7.25 $38.51 $2,300 $2,252.16 $31.22 $16.62 $8.31 $39.53 $2,400 $2,350.08 $31.26 $18.67 $9.33 $40.59 $2,500 $2,448.00 $15.61 $36.39 $18.20 $33.80 $2,600 $2,545.92 $0.00 $54.08 $27.04 $27.04 $2,700 $2,643.84 $0.00 $56.16 $28.08 $28.08 49 $2,600 $2,545.92 $0.00 $54.08 $27.04 $27.04 $2,500 $2,448.00 $52.00 $26.00 $26.00 51 $2,400 $2,350.08 $49.92 $24.96 $24.96 52 $22.88 $2,200 $45.76 $2,154.24 $22.88 $2,000 $1,958.40 $41.60 $20.80 $20.80 Instructions Cost of Capital Capital Budgeting The cash flows in Table 3 are correct. The NPV column is incorrecy. Your column assumes that all cash flows are in year 1 and uses a discount rate of 50% ($380) $40.90 $52.20 $47.00 $43.70 $38.50 $39.50 $40.60 $33.80 $27.00 $28.10 $27.00 $26.00 $25.00 $22.90 100%) AGO Type here to search NO $1,800 $1,762.56 $1,500 $1,468.80 $1,200 $1,175.04 $800 $783.36 $400 $391.68 $37.44 $31.20 $24.96 $16.64 $18.72 $15.60 $12.48 $8.32 $4.16 $18.72 $15.60 $12.48 $8.32 $4.16 $8.32 S $20.80 $18.70 $15.60 $12.50 $8.30 $4.20 $56.00 $366.30 ($380) ($13.70) 6.40% NPV function Cash Flow Zero NPV IRR Instructions Cost of Capital Capital Budgeting 1009 Type here to search
Step by Step Solution
There are 3 Steps involved in it
Step: 1

Get Instant Access to Expert-Tailored Solutions
See step-by-step solutions with expert insights and AI powered tools for academic success
Step: 2

Step: 3
Ace Your Homework with AI
Get the answers you need in no time with our AI-driven, step-by-step assistance
Get Started
Investing For Women Smart Strategies To Start Investing Now With Confidence Low Risk And Minimal Effort
Authors: Mike Hartley ,Hannah Rosenstein
1st Edition
979-8393237202