

Answered step by step
Verified Expert Solution
Question
1 Approved Answer
Current ratio of ve actions would improve this rati 17.2 Southwest Physicians, a medical group practice, i formed. It will need $2 million of
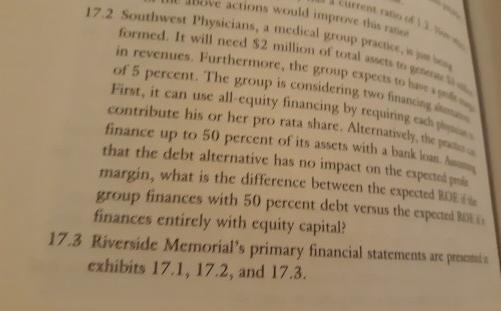

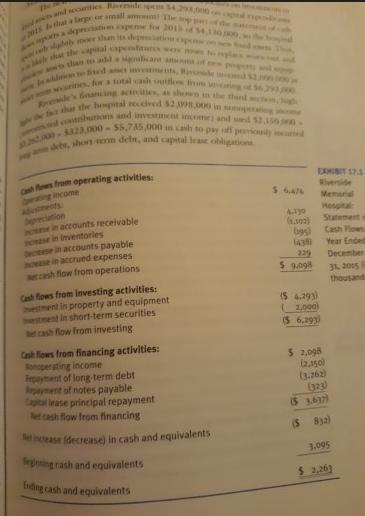
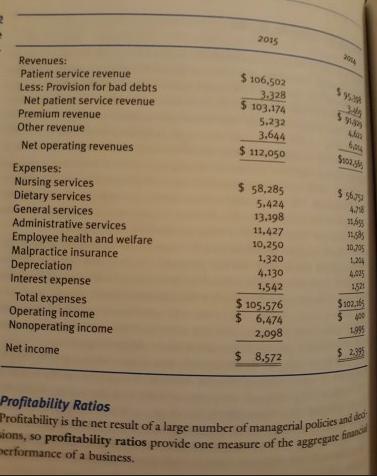
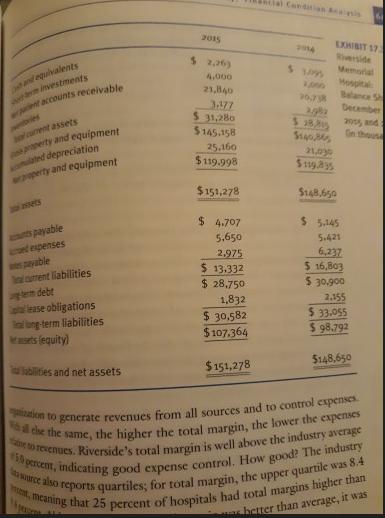
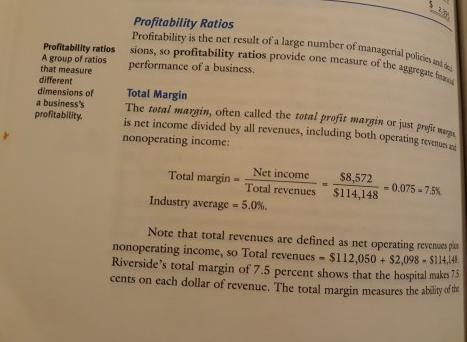
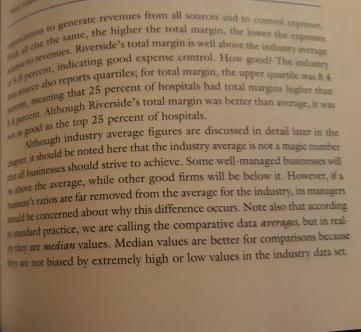
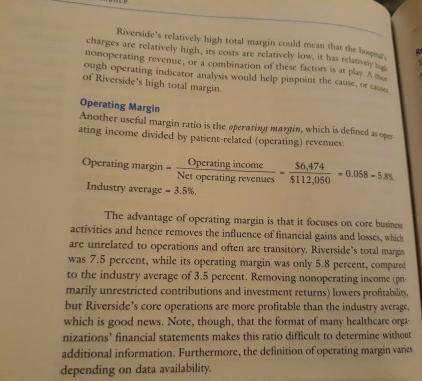


Current ratio of ve actions would improve this rati 17.2 Southwest Physicians, a medical group practice, i formed. It will need $2 million of total assets to genera in revenues. Furthermore, the group expects to have as of 5 percent. The group is considering two financing d First, it can use all-equity financing by requiring each p contribute his or her pro rata share. Alternatively, the p finance up to 50 percent of its assets with a bank loan. A that the debt alternative has no impact on the expected pis margin, what is the difference between the expected ROE group finances with 50 percent debt versus the expected B finances entirely with equity capital? 17.3 Riverside Memorial's primary financial statements are prese exhibits 17.1, 17.2, and 17.3. h are ints ve ve Chapter 17: Financial Condition Analy a. Calculate Riverside's financial ratios for 2014. Assume that Riverside had $1,000,000 in lease payments and $1,400,000 in debt principal repayments in 2014. (Hint: Use the book discussion to identify the applicable ratios.) b. Interpret the ratios. Use both trend and comparative analyses. For the comparative analysis, assume that the industry average data presented in the book are valid for both 2014 and 2015. 17.4 Consider the following financial statements for BestCare HMO, a not-for-profit managed care plan: BestCare HMO Statement of Operations and Change in Net Assets, Year Ended June 30, 2015 Premiums earned (in thousands) Revenue: $26,682 ? 1,689 Interest and other income 242 $28,613 Coinsurance ANY The and scotics. Riverside spem 54 2015 that a large or small ammm! The s pa depreciation expense for 2011 plab me shan its degessation Mele shat the capital cxpenditures WOU then to add a signicant as a men Bed amet ivements, Ravende in rities, for a total cash outflow from wearing of S Reside's financing activities, as shown in the t z that the hospital received $2 PPR,000 in operating i 200-$323,000-$5,745,000 in cash to pay off pessicily d corbutions and investment income and sad $2,150- adbe, short term deln, and capital lease obligations Cash flows from operating activities: income accounts receivable ase in Inventories Decrease in accounts payable se in accrued expenses Net cash flow from operations Cash flows from investing activities: estment in property and equipment tment in short-term securities cash flow from investing Cash flows from financing activities: Ronoperating income payment of long-term debt payment of notes payable Capital lease principal repayment Net cash flow from financing Net increase (decrease) in cash and equivalents Segining rash and equivalents Ending cash and equivalents $6.476 EXHIBIT 17.5 Riverside Memorial Hospital 4.130 (1.303) Statement s (95) Cash Flows (43 Year Ended 229 $ 9.09 December 31, 2015 thousands (5 4.293) 2,000) ($6,293) 5 2,098 (2.150) (3.262) (323) ($3.637) ($ 832) 3,095 $2,263 2015 2014 Revenues: Patient service revenue $106,502 Less: Provision for bad debts 3.328 $95 Net patient service revenue $103.174 Premium revenue 5.232 Other revenue 3.644 Las 604 Net operating revenues $112,050 Soa Expenses: Nursing services Dietary services $ 58,285 $56.753 5.424 4.7% Depreciation General services Administrative services Employee health and welfare Malpractice insurance Interest expense 13.198 11,6% 11,427 11.5 10,250 10,705 1,320 1,204 4.130 4,025 1521 1,542 Total expenses Operating income $105.576 $102,165 Nonoperating income $ 6,474 2,098 $ 400 1.995 $2.995 Net income $ 8,572 Profitability Ratios Profitability is the net result of a large number of managerial policies and deo sions, so profitability ratios provide one measure of the aggregate financi performance of a business. 2015 Condition Anais 2914 EXHIBIT 17 and equivalents $ 2,26) Riverside em investments veories pent accounts receivable 4.000 $3095 Memorial 21,840 2000 Hospital 30,738 3.177 Balance Sh current assets $31,280 December ated depreciation property and equipment $145.158 $28,815 2015 and Stap 365 On thous 25.160 woperty and equipment $119.998 21,030 $119.835 $151,278 300 assets $148,650 s payable $ 4.707 ed expenses spayable current liabilities $ 13.332 term debt $ 28,750 lease obligations 1,832 long-term liabilities $ 30,582 5,650 2,975 $ 5.145 5.421 6,237 $ 16,803 $ 30.900 2.155 $ 33,055 (equity) $107,364 labilities and net assets $151,278 $ 98.792 $148,650 Wall else the same, ization to generate revenues from all sources and to control expenses. ane to revenues. Riverside's total margin is well above the industry average the higher the total margin, the lower the expenses 5 percent, indicating good expense control. How good? The industry a source also reports quartiles; for total margin, the upper quartile was 8.4 ent, meaning that 25 percent of hospitals had total margins higher than hbetter than average, it was Profitability Ratios Profitability ratios sions, so profitability ratios provide one measure of the aggregate fina Profitability is the net result of a large number of managerial policies and d A group of ratios that measure different dimensions of a business's profitability. performance of a business. Total Margin The total margin, often called the total profit margin or just profit marg is net income divided by all revenues, including both operating revenues nonoperating income: Total margin- Net income Total revenues $8,572 $114,148 -0.075-7.5% Industry average = 5.0%. Note that total revenues are defined as net operating revenues plus nonoperating income, so Total revenues $112,050 + $2,098-$114.14 Riverside's total margin of 7.5 percent shows that the hospital maken 75 cents on each dollar of revenue. The total margin measures the ability of the on to generate revenues from all sources and to control espeses telse the same, the higher the total margin, the lower the expenses o revenues, Riverside's total margin is well above the industry average 40 percent, indicating good expense control. How good? The industry warce also reports quartiles; for total margin, the upper quartile was 8.4 that 25 percent of hospitals had total margins higher than 14 percent Although Riverside's total margin was better than average, it wa st as good as the top 25 percent of hospitals. meaning Although industry average figures are discussed in detail later in the ag, it should be noted here that the industry average is not a magic number all businesses should strive to achieve. Some well-managed businesses will above the average, while other good firms will be below it. However, if a 's ratios are far removed from the average for the industry, its managen ld be concerned about why this difference occurs. Note also that according andard practice, we are calling the comparative data averages, but in real- they are median values. Median values are better for comparisons because they are not biased by extremely high or low values in the industry data set. Riverside's relatively high total margin could mean that the hospi charges are relatively high, its costs are relatively low, it has relatively nonoperating revenue, or a combination of these factors is at play A ough operating indicator analysis would help pinpoint the cause, or c of Riverside's high total margin. Operating Margin Another useful margin ratio is the operating margin, which is defined as ope ating income divided by patient-related (operating) revenues: Operating margin $6,474 -0.058-5.8% Operating income Net operating revenues $112,050 Industry average- 3.5% The advantage of operating margin is that it focuses on core busines activities and hence removes the influence of financial gains and losses, which are unrelated to operations and often are transitory. Riverside's total margin was 7.5 percent, while its operating margin was only 5.8 percent, compared to the industry average of 3.5 percent. Removing nonoperating income (pn- marily unrestricted contributions and investment returns) lowers profitability. but Riverside's core operations are more profitable than the industry average, which is good news. Note, though, that the format of many healthcare orga nizations' financial statements makes this ratio difficult to determine without additional information. Furthermore, the definition of operating margin varies depending on data availability. difficult additional information. Furthermore, the definition of e depending on data availability Return on Assets The ratio of net income to total assets measures the return on a s just called return on assets (ROA): Net income $8,572 Return on assets= Total assets $151,278 -0.057-57 Industry average = 4.8%. Riverside's 5.7 percent ROA, which means that each della f generated 5.7 cents in profit, is well above the 4.8 percent aveng hospital industry. ROA tells managers how productively, in a fina a business is using its assets. The higher the ROA, the greater the t for each dollar invested in assets and hence the more productive the ROA measures both a business's ability to control expenses, as express the total margin, and its ability to use its assets to generate revenue The ld help pinpoint the cause, or these factors is at play. A low, it has relatively that the bo ing margin, which is defined as ope operating) revenues: $6,474 ues $112,050 -0.058-5 is that it focuses on core busines of financial gains and losses, whic "ansitory. Riverside's total margin was only 5.8 percent, compared oving nonoperating income (p ment returns) lowers profitabilit table than the industry average ormat of many healthcare org o difficult to determine without ition of operating margin vanis Return on Equity Chapter 17: Financial Condition Analysis The ratio of net income to total equity (net assets) measures the return on equity (ROE): Return on equity= $8,572 = =0.080-8.0% Net income Total equity $107,364 Industry average -8.4%. Riverside's 8.0 percent ROE is slightly below the 8.4 percent industry average. The hospital was able to generate 8.0 cents of income for each dol- lar of equity investment, while the average hospital produced 8.4 cents. ROE is especially meaningful for investor-owned businesses because owners are concerned with how well the business's managers are using owner-supplied capital, and ROE answers this question. For not-for-profit businesses such as Riverside, ROE tells its board of trustees and managers how well, in financial terms, its community-supplied capital is being used. Riverside's 2015 margin measures and ROA were above the industry averages, yet the hospital's ROE is below the average. As we explain later in the section on Du Pont analysis, this seeming inconsistency is a result of the hospital's low use of debt financing. Liquidity Ratios One of the first concerns of most managers, and the major concern of a firm's creditors, is the business's liquidity. Will the business be able to meet its cash obligations as they come due? Liquidity ratios are designed to answer that question. Riverside has debts totaling more than $13 million (i.e., its current liabilition) that must be paid off within the coming year. Will the hospital be perating mange 67-5.7% Ratios that measure the ability of a business to meet its cash evoces of most managers, and the major concern of a firm's sahe business's pidity Will the business be able to meet in cash as they come due! Liquidity ratios are designed to answer that Liquidity ratios Renide has debes totaling more than $13 million (ie., its current that must be paid off within the coming year. Will the hospital be make these payments? A full liquidity analysis requires the use of a cash ich we discussed in Chapter 16. However, by relating the amount obligations as them and other current assets to current obligations, ratio analysis provides come due cay-to-use, rough measure of liquidity. The ratio is calculated by dividing current assets by current liabilities: Current Ratio ch dollar of an t average for the a financial r the net income active the assets as expressed by Current ratio= Current assets Current liabilities $31,280 $13,332 2.3, or 2.3 times. evenue. Industry average=2.0. The current ratio tells managers that the immediate liquidation of Riv- mide's current assets at book value would provide $2.30 of cash for every $1 of current liabilities. If a business is getting into financial difficulty, loans (notes payable), and so on. If these current liabilities rise faster th begin paying its accounts payable more slowly, building up short-term current assets, the current ratio will fall, and this could spell trouble. Be the current ratio is an indicator of the extent to which short-term daim gations are covered by assets that are expected to be converted to cash in th near term, it is a commonly used measure of liquidity. Riverside's current ratio is slightly above the average for the hope industry. Because current assets should be converted to cash in the near futur it is highly probable that these assets could be liquidated at close to the stated values. With a current ratio of 2.3, the hospital could liquidate curre assets at only 43 percent of book value and still pay off current crediton full. (To determine the minimum proportion of current assets that must be converted to cash to meet current obligations, divide the number 1 by the current ratio. For Bayside, +2.3 0.43, or 43 percent. This proportions confirmed by noting that 0.43 x $31,280,000-$13,332,000, the amoun of current liabilities.) Days Cash on Hand = The current ratio measures liquidity on the basis of balance sheet accounts and hence is a static measure of liquidity. However, the true measure of a ass St th Days Cash on Hand The current ratio measures liquidity on the basis of balance she and hence is a static measure of liquidity. However, the true business's liquidity is whether it can meet its payments as they liquidity is more related to cash inflows and outflows than a liabilities. The day-cash-on-hand ratio moves closer to those facon he determine liquidity: Days cash on hand -- Cash and equivalents +Short-term investmen (Expenses - Depreciation)/365 $2,263 +$4,000 ($105,576 Industry average 30.6 days. $6,263 $4,130) / 365 $277.93 The denominator of the equation estimates average daily cal by stripping out noncash expenses (depreciation) from reported total and then dividing by 365, the number of days in a year. The nume cash and securities that are available to make those cash paymenn. Bea Riverside's days cash on hand is lower than the industry average, in qu position as measured by days cash on hand is worse than that of the am hospital. For Riverside, the two measures of liquidity, current ratio and dan on hand, give conflicting results. Perhaps the average hospital has a g proportion of cash and equivalents and short-term investments in its c Debt ma Capitalizati the extent te 1 Coverage r the extent & prodits The two es examin Capitalization The to of t ratio, me Indum For t abilities. In of the balar cused, c ent defir Crea the cushio bon. Cons inancial building up then and this could spell to y current liabilities atent to which short term d pected to be converted to re of liquidity. Chapter 17: Financial Condition Analysis sets mix than does Riverside. More analysis would be required to make a supportable judgment concerning Riverside's liquidity position. Remember, though, that the cash budget, which we discussed in Chapter 16, is the primary tool used by managers to ensure liquidity. Debt Management (Capital Structure) Ratios above the average for the converted to cash in the n uld be liquidated at close the hospital could liquidate d still pay off current cred on of current assets that ma ons, divide the numbers or 43 percent. This propert 00-$13,332,000, the a asis of balance sheet acc wever, the true measured ayments as they come due atflows than it is to asses In those factors that m The extent to which an organization uses debt financing, or financial leverage, is an important measure of financial performance for several reasons. First, by raising funds through debt, owners of for-profit businesses can maintain control with a limited investment. For not-for-profit organizations, debt financing allows more services to be provided than if the organization were solely financed with contributions and earnings. Next, creditors look to equity capital to provide a margin of safety; if the owners (or community) have provided only a small proportion of total financing, the risks of the enterprise are borne mainly by its creditors. Finally, if a business earns more on investments financed with borrowed funds than it pays in percentage interest, its ROE is increased. Debt management ratios fall into two categories: 649 1. Capitalization ratios. These ratios use balance sheet data to determine the extent to which borrowed funds have been used to finance assets. 2. Coverage ratios. Here, income statement data are used to determine the extent to which fixed financial charges are covered by reported profits. Debt ma ratios A grou that ro the ex The two sets of ratios are complementary, so most financial statement a bu finam (cap the extent ses examine both types. by reported Business's nancial leverage (capital structure) The two sets of ratios are complementary, so most financial statement Capitalization Ratio 1: Total Debt to Total Assets (Debt Ratio) The ratio of total debt to total assets (total liabilities and equity), called the eratie, measures the percentage of total capital provided by creditors: tors that m rm investments n)/365 $6,263 22.5 day 277.93 daily cash expenses Debt ratio= Total debt Total assets $43,914 $151,278 -0.290, or 29.0% Industry average 42.3% For this ratio, debt typically is defined as all debt, including current labilities. In essence, debt is defined here as everything on the capital side the balance sheet except equity. However, as illustrated by the next ratio cussed, capitalization ratios have several variations, many of which use dif- ient definitions of what constitutes debt. orted total expense ae numerator is the payments. Becaus crage, its liquidn mat of the average tio and days cash mal has a greater ts in its current Creditors prefer low debt ratios because the lower the ratio, the greater the cushion against creditors' losses in the event of bankruptcy and liquida- on Conversely, owners of for-profit firms may seek high leverage either to leverage to offer more services. leverage up returns or because selling new stock would mean ging g degree of control. In not-for-profit organizations, managers may sek Riverside's debt ratio is 29.0 percent. This means that its credit supplied somewhat less than one-third of the business's total financing another way, each dollar of assets was financed with 29 cents of den consequently, 71 cents of equity. (The equity ratio is defined as 1-Des so Riverside's equity ratio is 71 percent.) Because the average debt ratio let hospital industry is more than 40 percent, Riverside uses significantly les than the average hospital. The low debt ratio indicates that the hospital find it relatively easy to borrow additional funds, presumably at favorable Note that the debt-to-equity ratio, defined as Total debt + Total is a close relative of the debt ratio. These ratios are transformations of another and provide the same information but with a different twist. Be the debt ratio and debt-to-equity ratio increase as a business uses a g proportion of debt financing, but the debt ratio rises linearly and approache a limit of 100 percent, while the debt-to-equity ratio rises at a faster rate approaches infinity. Lenders, in particular, prefer to use the debt-to-equi ratio rather than the debt ratio because it tells them how much capital cr tors have provided to the organization per dollar of equity capital. The highe this ratio, the riskier the creditors' position. Other analysts tend to prefer the debt ratio because it makes it easier to visualize the liabilities and equity ma on the balance sheet. capital st best refle R industry permar has un Covera The r inter beca inter EBI EB Equity capital The debt ratio because it makes it easier to visualize the liabilities and eq position. Other analysts tend to po on the balance sheet. Capitalization Ratio 2: Debt-to-Capitalization Ratio The debt-to-capitalization ratio, which is long-term debt divided by long in a business's permanent (long-term) capital structure. This ratio is also c capital (long-term debt plus equity), focuses on the proportion of des the long-term debt-to-capitalization ratio or just capitalization ratio (S that we have included capital lease obligations in our definition of long debt because such obligations are similar in nature to long-term debt Debt-to-capitalization ratio=- Long-term debt Long-term debt + Equity $30,582 $30,582+$107,364 0.222, or 22.2% Industry average = 34.6%. Many analysts believe that the debt-to-capitalization ratio best relea the capital structure of a business. This belief is based on the fact that mos businesses use as much spontaneous free credit (current liabilities less short-tem bank loans) as they can get. Furthermore, short-term interest-bearing des typically is used only to fund temporary current asset needs. Thus, the "me" CAM by in - 651 managers may can giving w capital structure of a business-the one that reflects its target struct best reflected by a ratio that focuses on permanent Deng term financing Riverside's debt-to-capitalization ratio is 22.2 percent, compan industry average of 34.6 percent. This low use of debt financing in Redd's permanent capital mix confirms the conclusion made earlier that the hospital has unused debt capacity. Coverage Ratio 1: Times Interest Earned Ratio The times interest earned (TIE) ratio is determined by dividing earnings before interest and taxes (EBIT) by interest charges. EBIT is used in the numerator because it represents the amount of accounting income that is available to pay interest expense. For a not-for-profit organization, which does not pay taxes, EBIT - Net income + Interest expense, whereas for a for-profit business, EBIT-Net income + Interest expense + Taxes. Riverside's TIE ratio is 6.6 This means that its crud e business's total financ ced with 29 cents of d catio is defined as 1-De ese the average debt ro rside uses significantly dicates that the hospital presumably at favorable das Total debt + Toul s are transformations with a different twist as a business uses a gra ises linearly and appre atio rises at a faster ra to use the debt-to- m how much capital equity capital. The h analysts tend to prefer t liabilities and equit $8,572+$1,542 $10,114 -6.6 Interest expense $1,542 $1,542 TIE ratio= Industry average = 4.0. EBIT The TIE ratio measures the number of dollars of accounting income (as opposed to cash flow) available to pay each dollar of interest expense. In essence, it is an indicator of the extent to which income can decline before it is less than annual interest costs. Failure to pay interest can bring legal action by the firm's creditors, possibly resulting in bankruptcy rred 6.6 times, so it has $6.60 of accounting dustry average TIE tit isualize the liabilities and o Other analysts tend to pede of equity capital. The kw much cap the debe tion Ratio ong-term debt divided by long ses on the proportion of debt s al structure. This ratio is also c er just capitalization ratio. (N ns in our definition of long nature to long-term debt rm debt ebt+ Equity 7,364 0.222, or 22.2% TIE ratio EBIT Interest expense badustry average 4.0. $8,572 51.542 $10.114 $1,542 $1,542 The TIE ratio measures the number of dollars of accounting inc (as opposed to cash flow) available to pay cach dollar of interest expense In is less than annual interest costs. Failure to pay interest can being legal con esence, it is an indicator of the extent to which income can decline before by the firm's creditors, possibly resulting in bankruptcy. Riverside's interest is covered 6.6 times, so it has $6.60 of accounting income to pay each dollar of interest expense. Because the industry average TIE ratio is four times, the hospital is covering its interest charges by a relatively high margin of safety. Thus, the TIE ratio reinforces the previous conclusions based on the debt and debt-to-capitalization ratios-namely, that the hospital italization ratio best reflec based on the fact that mos rent liabilities less short-tem term interest-bearing de et needs. Thus, the "true" could easily expand its use of debt financing. Coverage ratios are often better measures of a firm's debt utilization than capitalization ratios because coverage ratios discriminate between low-interest rate debe and high-interest rate debt. For example, a medical group practice might have $10 million of 4 percent debt on its balance sheet, while another might have $10 million of 8 percent debt. If both practices have the same income and assets, both would have the same debt ratio. However, the group that pays 4 percent interest would have lower interest charges and hence would be in bet- ter financial condition than the group that pays 8 percent. This difference in financial condition is captured by the TIE ratio. Coverage Ratio 2: Cash Flow Coverage Ratio Although the TIE ratio is easy to calculate, it has three major deficiencies. First, leasing is a common form of financing, and the TIE ratio ignores lease Finance payments, which, like debt payments, are contractual obligations S many debt contracts require that principal payments be made over the the loan, rather than only at maturity. Thus, most organizations mun fixed financial charges associated with debt financing besides inter ments. Finally, the TIE ratio ignores the fact that accounting income, w measured by EBIT or net income, does not reflect the actual cash flow able to meet a business's fixed payments. These deficiencies are comm the cash flow coverage (CFC) ratio, which shows the amount by which flow covers fixed financial requirements. Here is Riverside's 2015 CFC assuming the hospital had $1,368,000 of lease payments and $2,000, required debt principal repayments: CFC ratio= EBIT+Lease payments + Depreciation expense Interest expense + Lease payments + Debt principal/1- $10,114+$1,368 +$4,130 $1,542 +$1,368+$2,000/(1-0) Industry average = 2.3. Fixed Asse The fixed s the reve Note t $112,4 ance s ated $15,612 $4,910 avera 3.2 as pr indu in it Like its TIE ratio, Riverside's CFC ratio exceeds the industry standard atal fixed payments with cash sho Asset management ratios Financial statement analysis ratios that measure how effectively a firm is managing its assets. $15,612 $1,542+$1,368+$2,000/(1-0) $4,910 Industry average-2.3. 31 as is t and 95 cent neage of 2.2 tit productively industry is 1.1; thus, in its fixed-asset utilia Before conder should be pointed ou Like its TIE ratio, Riverside's CFC ratio exceeds the indiantry was flow than is the average hospital. This fact should be reassuring both to indicating that Riverside is better at covering total fixed payments with tors and to management as it reinforces the view that Riverside has debt capacity. You may be wondering why there is a (1-T) term applied to debt principal. The reason is that investor-owned firms must make pini repayments with after-tax dollars and hence must earn more pretas d to both pay taxes and make the principal repayment. The groned-sp at which results from dividing by 1-7, gives the amount of pretax dolla are needed to cover the required principal repayments. Thus, the calcul which contains pretax dollars in the numerator, now has pretax dollavia denominator and hence is consistent in format. Asset Management (Activity) Ratios as over ratio for con balance sheet reflect and depreciation hav past to be seriously much of its plant a the same physical c of fixed assets, we faed-asset turnove with inflation thar Total Asset Turne The total asset t business's assets The next group of ratios, the asset management ratios, is designed to m sure how effectively a business's assets are being utilized. These ratios hd answer whether the amount of each type of asset reported on the bal sheet seems reasonable, too high, or too low in view of current (or projected operating levels. Riverside and other hospitals must borrow or raise equ capital to acquire assets. If they have too many assets for the volume of se vices provided, their capital costs will be too high and their profits willbe depressed. Conversely, if the level of assets is too low, volume may be lo vital services not offered. Tota Again, note revenues. Each side's total a Net Fixed Asset Turnover Ratio sures the utilization of property and equipment, and it is the ratio of total The fixed art turnover ratie, also called the fixed at stilisation ratio, m (all) revenues to net fixed assets (property and equipment t reflect the actual cash accounting income besides int ations These deficiencies are co shows the amount by which u cre is Riverside's 2015 C ase payments and $2.08 s+ Depreciation expense ments + Debt principal/- $15,612 $4,910 -0) =32 xceeds the industry stand tal fixed payments with a be reassuring both to a that Riverside has untapp 7) term applied to firms must make prin pretax dile Total revenues Fixed asset turnover- $114,148 Net fixed assets -0.95. $119,998 Industry average-2.2. Note that total revenues include both operating and nonoperating revenues $112,050 $2,098 $114,148. Also, net fixed assets are listed on the bal ance sheet as net property and equipment. Riverside's ratio of 0.95 indicates that each dollar of fixed assets gener ated 95 cents in total revenue. This value compares poorly with the industry average of 2.2 times, indicating that Riverside is not using its fixed assets as productively as is the average hospital. (The lower-quartile value for the industry is 1.1; thus, Riverside falls in the bottom 25 percent of all hospitals in its fixed-asset utilization.) Before condemning Riverside's management for poor performance, it should be pointed out that a major problem arises from the use of the fixed asset turnover ratio for comparative purposes. Recall that most asset values listed on the balance sheet reflect historical costs rather than current market values. Inflation and depreciation have caused the values of many assets that were purchased in the past to be seriously understated. Therefore, if an old hospital that had acquired much of its plant and equipment years ago is compared to a new hospital with the same physical capacity, the old hospital, because of a much lower book value of fixed assets, would report a much higher turnover ratio. This difference in of the inability of financial statements to deal The manaRCTS In 2015, R current as) Riverside's physical assets are newer dth of the average hospital. Thus, the pal is offering more up to date facilities dage, and it will probably have fewer papenditures in the near future. On the her hand, Riverside's net fixed asset valuation will be relatively high, which, as pointed out er, biases the hospital's fixed asset and total aver ratios downward. This fact raises se questions about the interpretation of the mover ration calculated previously to measure effectiveness a performance, which is asset management te (ACP) and day' sales ent accounts receivable to a of days that it takes an n theory, the denomina mmediate cash payments, bes patient services revenue e has not been included es collected either before or ot affect receivables ent accounts receivable at service revenue/365 10 305 $21,840 $282.67 77.3 Analysis For Your Consideration How Many Ratios Are Enough In our discussion of face sent to analysis, we discussed on monly used to help interget Sancial t data. Although that may seen a c our discussion just scratched the surface for example, one of the most widely sets of comparative data for hospitais, the Aim of Hospital Financial and Operating lished annually by Optumyte, provides data on more than yo financial ratios could Without too much additional work, y probably compile a so fancial ratios studies have shown that about gn percent of the information contained in financial statements can be uncovered using so or so carefully selected ratios How many ratios do you think are enough? Does it matter how the ratios are selected? is the a cost to using more ratios than necessary? Wha is the disadvantage of generating too much dat Comparative and Trend Analyses When conducting financial ratio analysis, the value of a particular ratio, in the absence of other information, reveals almost nothing about a business's financial condition. For mample, if it is known that a nursing home management company has a current ratio of 2.5, it is virtually impossible to say whether this is good or bad. Additional data are needed to help interpret the results of this ratio analy sis. In the discussion of Riverside's financial ratios, the focus was on comparative analysis that is, the hospital's ratios were compared with the average ratios for the industry. Another useful ratio analysis tool is trend analysis, in which the trend of a single ratio is analyzed over time. Trend analysis gives clues about whether ial situation is improving, holding constant, or deteriorating lend analyses in a single graph Trend and A technio examin ratio m value- over t it is k deter as fixed asset utilization.) vering total fixed payments w exceeds the industry wa ct should be reassuring both to the view that Riverside has una re is a (1-7) term applied to r-owned firms must make prin nce must earn more pretas d with the industry productively as is the average hospital. (The lower-quartile value for the ge of 2.2 times, indicating that Riverside is not using its sed try is 1.1; thus, Riverside falls in the bottom 25 percent of all loop Before condemning Riverside's management for poor performance, should be pointed out that a major problem arises from the use of the fed et mower ratio for comparative purposes. Recall that most asset values listed on the balance sheet reflect historical costs rather than current market values, Inflation and depreciation have caused the values of many assets that were purchased in the par to be seriously understated. Therefore, if an old hospital that had acquired mach of its plant and equipment years ago is compared to a new hospital with the same physical capacity, the old hospital, because of a much lower book valuc fand-asset turnover is more reflective of the inability of financial statements to deal of fixed assets, would report a much higher turnover ratio. This difference in with inflation than of any inefficiency on the part of the new hospital's managen. epayment. The grossed-up a the amount of pretax dollan ta repayments. Thus, the calculatio ator, now has pretax dollars in the mat. ment ratios, is designed to no eing utilized. These ratios help asset reported on the balan view of current (or projected s must borrow or raise equity y assets for the volume of so high and their profits will be o low, volume may be lost or Total Asset Turnover Ratio The total asset turnover ratio measures the turnover, or utilization, of all of a business's assets. It is calculated by dividing total (all) revenues by total assets: Total asset turnover = Total revenues Total assets $114,148 $151,278 =0.75. Industry average 0.97. Again, note that total revenues include both operating and nonoperating revenues. Each dollar of total assets generated 75 cents in total revenues. River- side's total asset ratio is below the industry average, but not as far below as its Du Pont analysis A financial statement analysis tool that decomposes return on equity into three components: profit margin, total asset turnover, and quity multiplier. 2011 12.5% 2.6% 8.6% 2012 10.0 2.5 8.6 2013 6.7 2.8 73 2014 2.4 4.1 7.2 8.0 3.8 2015 7.4 550 Tying the Financial Ratios Together: Du Pont Analy espu while the only percent ROA comprises 5.0 percent RC plier, which sh capital, to obt calculated dire 8.0% How measures exp and financial ROE Financial ratio analysis provides a great deal of information about financial condition, but it does not provide an overview, nor does it t ratios together. Du Pont analysis, so named because managers at the b Company developed it, provides an overview of a business's financial cond helps managers and investors understand the relationships among The analysis decomposes return on equity, one of the most importa of a business's profitability, into the product of three other ratios, ca has an important economic interpretation. The result is the Du P ROE Total margin x Total asset turnover x Equity multiple = Net income Net income Total equity Total revenues Key Equ The Du into th The F sure and X Total revenues Total assets Total asses par x Total equ ma 2013 2014 Return on Equity (ROE) 2015 Median Lower Upper Qu 13.3% Industry Quartile Median .6% 8.6% -5 8.6 8 7.2 12.0 7.2 12.1 7.4 13.3 12.3 Reside's 2015 data are used to illustrate the Du Pompton ather: Du Pont Analysis $8,572 $8,572 $114.148 $151.278 $107,364 $114,148 $151.278 $107 3 8.0%= 7.5% x 0.75 x 14 5.6% x 14. 657 In the Du Pont equation, the product of the first two terms on the right side is return on assets (ROA), so the equation can also be wemon ROE ROA x Equity multiplier. Riverside's 2015 total margin was 7.5 per cent, so the hospital made 7.5 cents profit on each dollar of total revenue Furthermore, assets were turned over (or created revenues) 0.75 times during the year, so the hospital carned a return of 7.5% x0.75-5.6% on ins This value for ROA, when rounded, is the same as was calculated previously in our ratio analysis discussion. If the hospital used only equity financing, its 5.6 percent ROA would equal its ROE. However, creditors supplied 29 percent of Riverside's capital, while the equity holders (the community) supplied the rest. Because the 5.6 percent ROA belongs exclusively to the suppliers of equity capital, which comprises only 71 percent of total capital, Riverside's ROE is higher than its 5.6 percent ROA. Specifically, ROA must be multiplied by the equity multi- plier, which shows the amount of assets working for each dollar of equity capital, to obtain the ROE of 8.0 percent. This 8.0 percent ROE could be calculated directly: ROE- Net income + Total equity - $8,572 + $107,364 -8.0%. However, the Du Pont equation shows how total margin, which measures expense control; total asset turnover, which measures aut utilization; and financial leverage, which measures debt utilization, interact to determine ROE.
Step by Step Solution
There are 3 Steps involved in it
Step: 1
To address part a of question 173 systematically well calculate the financial ratios using the 2014 data provided in the exhibits incorporating the assumptions of 1000000 in lease payments and 1400000 ...
Get Instant Access to Expert-Tailored Solutions
See step-by-step solutions with expert insights and AI powered tools for academic success
Step: 2

Step: 3
Ace Your Homework with AI
Get the answers you need in no time with our AI-driven, step-by-step assistance
Get Started
Dynamical Corporate Finance
Authors: Umberto Sagliaschi, Roberto Savona
1st Edition
3030778525, 9783030778521