

Answered step by step
Verified Expert Solution
Question
1 Approved Answer
can someone answer this as soon as possible i need the formulas to solve rach column AFANDI H2>38500, H272000, H2110000),H18*32%))))) First Name Gary Cynthia Kevin
can someone answer this as soon as possible
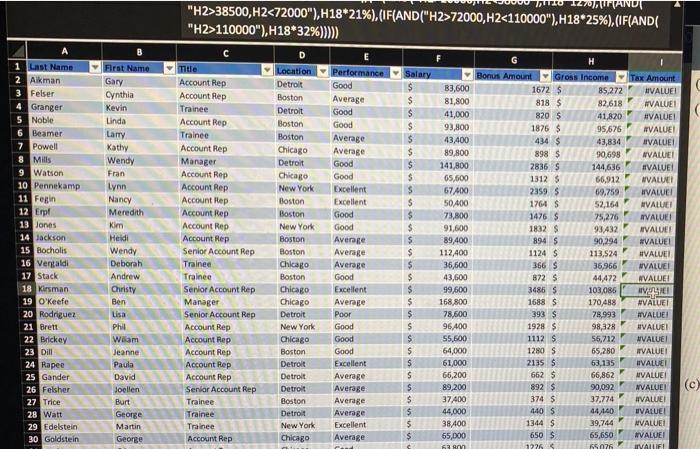
i need the formulas to solve rach column 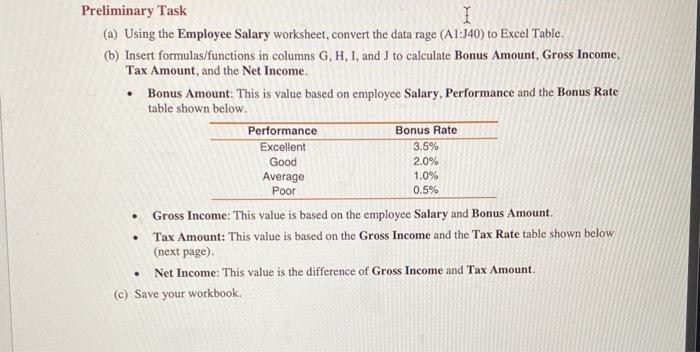
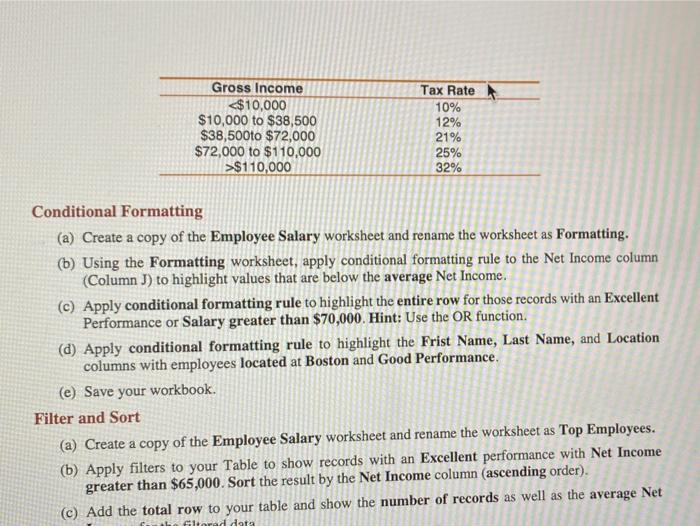
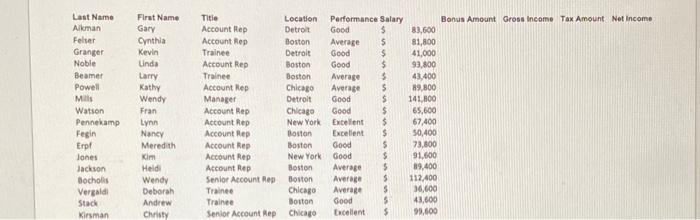
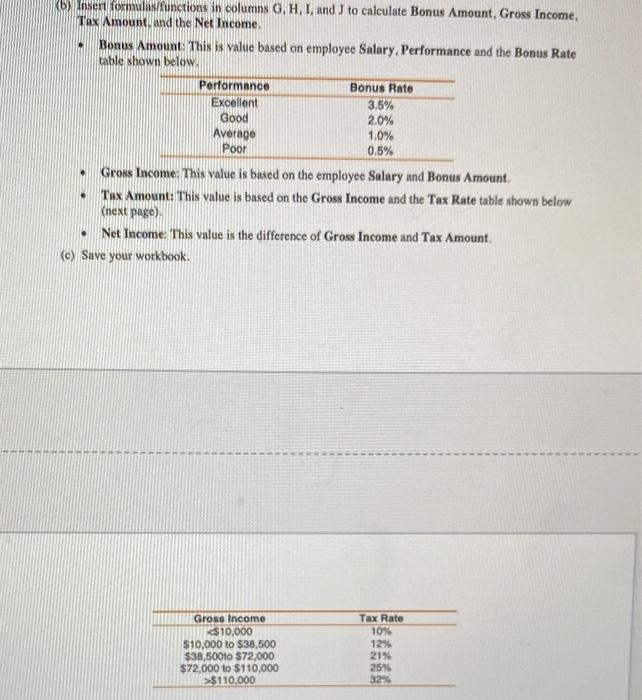
AFANDI "H2>38500, H272000, H2110000"),H18*32%))))) First Name Gary Cynthia Kevin Linda Lamy Kathy Wendy 52,154 1 Last Name 2 Alkman 3 Felser 4 Granger 5 Noble 6 Beamer 7 Powell 8 Mills 9 Watson 10 Pennekamp 11 Fegin 12 Erp 13 Jones 14 Jackson 15 Bocholis 16 Vengaldi 17 Stack 18 Kirsman 19 O'Keefe 20 Rodriguez 21 Brett 22 Brickey 23 Dill 24 Rapee 25 Gander 26 Felsher 27 Trice 28 Watt 29 Edelstein 30 Goldstein Fran Lynn Nancy Meredith Kim Heidi Wendy Deborah Andrew Christy Ben Lisa C Title Account Rep Account Rep Trainee Account Rep Trainee Account Rep Manager Account Rep Account Rep Account Rep Account Rep Account Rep Account Rep Senior Account Rep Trainee Trainee Senior Account Rep Manager Senior Account Rep Account Rep Account Rep Account Rep Account Rep Account Rep Senior Account Rep Trainee Trainee Trainee Account Rep Location Detroit Boston Detroit Boston Boston Chicago Detroit Chicago New York Boston Boston New York Boston Boston Chicago Boston Chicago Chicago Detroit New York Chicago Boston Detroit Detroit Detroit Boston Detroit New York Chicago Performance Good Average Good Good Average Average Good Good Excellent Excellent Good Good Average Average Average Good Excellent Average Poor Good Good Good Excellent Average Average Average Average Excellent Average ru Salary $ $ $ $ $ $ $ $ $ $ $ $ $ $ $ $ $ $ $ $ $ 5 S $ $ $ $ 5 $ B3,600 81,800 41,000 93,800 43.400 89,800 141,800 65,600 67400 50400 73,800 91,600 89,400 112,400 36,600 43,600 99,600 168,800 78,600 96,400 55,600 64,000 61,000 66,200 89,200 37400 44,000 38400 65,000 61 H 1 Bonus AmountGross Income Tax Amount 1672 $ 85,272 VALUEI 818 $ 82,618 #VALUE! 820 5 41,820 #VALUE 1876 $ 95,676 #VALUE! 434 $ 43,834 AVALUE 898 $ 90,698 NVALUEI 2836 S 144,636 #VALUE! 1312 $ 66,912 NVALUEI 2359 $ 69,759 HVALUEI 1764 $ AVALUEI 1476 $ 75,276 VALUE 1832 93.432 AVALUE! 894 $ 90,294 #VALUE! 1124 $ 113.524 HVALUE 366 $ 36,966 #VALUE! 872 5 44,472 AVALUE! 3486 S 103,086 VIEI 1688 $ 170,488 #VALUE! 393 $ 78,993 HVALUE! 1928 $ 98,328 UVALUEI 1112 56,712 WVALUE 1280 S VALUE 2135$ 63,135 #VALUE! 66,862 MVALUEI 90,092 NVALUE 374 $ 37,774 #VALUE! 440 S 44440 UVALUE 1344 S 39,744 NVALUE 650 $ #VALDE 1226 15076 IVALIFI Phil 65.280 Wam Jeanne Paula David Joellen Burt George Martin George 6625 892 $ (c) 65,650 (b) Insert formulas/functions in columns G, H, I, and J to calculate Bonus Amount, Gross Income, Tax Amount, and the Net Income. Bonus Amount: This is value based on employee Salary, Performance and the Bonus Rate table shown below Performance Bonus Rate Excellent 3.5% Good 2.0% Averago 1.0% Poor 0.5% Gross Income: This value is based on the employee Salary and Bonus Amount. Tax Amount: This value is based on the Gross Income and the Tax Rate table shown below (next page) Net Income: This value is the difference of Gross Income and Tax Amount. (e) Save your workbook. . . . Gross Income 10,000 $10,000 to $38,500 $38,50010 $72,000 $72,000 to $110,000 >$110,000 Tax Rate 10% 12% 21% 25% 32% Preliminary Task I (a) Using the Employee Salary worksheet, convert the data rage (A1:140) to Excel Table. (b) Insert formulas/functions in columns G, H, I, and I to calculate Bonus Amount, Gross Income, Tax Amount, and the Net Income. Bonus Amount: This is value based on employee Salary, Performance and the Bonus Rate table shown below. Performance Bonus Rate Excellent 3.5% Good 2.0% Average 1.0% Poor 0.5% Gross Income: This value is based on the employee Salary and Bonus Amount Tax Amount: This value is based on the Gross Income and the Tax Rate table shown below (next page) Net Income: This value is the difference of Gross Income and Tax Amount. (c) Save your workbook . . Gross Income $110,000 Tax Rate 10% 12% 21% 25% 32% Conditional Formatting (a) Create a copy of the Employee Salary worksheet and rename the worksheet as Formatting. (b) Using the Formatting worksheet, apply conditional formatting rule to the Net Income column (Column J) to highlight values that are below the average Net Income. (c) Apply conditional formatting rule to highlight the entire row for those records with an Excellent Performance or Salary greater than $70,000. Hint: Use the OR function. (d) Apply conditional formatting rule to highlight the Frist Name, Last Name, and Location columns with employees located at Boston and Good Performance. (e) Save your workbook. Filter and Sort (a) Create a copy of the Employee Salary worksheet and rename the worksheet as Top Employees. (b) Apply filters to your Table to show records with an Excellent performance with Net Income greater than $65,000. Sort the result by the Net Income column (ascending order). (c) Add the total row to your table and show the number of records as well as the average Net filtered data First Name Gary Cynthia Kevin Unda Last Name Alkman Felser Granger Noble Beamer Powell Mills Watson Pennekamp Fegin Erp Jones Jackson Bocholls Vergaldi Stach Kirsman Larry Kathy Wendy Fran Lynn Nancy Meredith Kim Held Wendy Deborah Andrew Christy Title Account Rep Account Rep Trainee Account Rep Trainee Account Rep Manager Account Rep Account Rep Account Rep Account Rep Account Rep Account Rep Senior Account Rep Trainee Trainee Senior Account Rep Location Performance Salary Detroit Good $ Boston Average S Detroit Good $ Boston Good $ Boston Average 3 Chicago Average 5 Detroit Good $ Chicago Good $ New York Excellent $ Boston Excellent $ Boston 5 New York Good $ Boston Average 5 Boston Average 5 Chicago Average 5 Boston Good 5 Chicago Excellent $ Bonus Amount Gross Income Tax Amount Net Income 83,600 81,800 41,000 93,800 43.400 89.800 141.800 65,600 67,400 50,400 73,800 91,600 89,400 112,400 30.600 43,600 99,800 Good Step by Step Solution
There are 3 Steps involved in it
Step: 1

Get Instant Access to Expert-Tailored Solutions
See step-by-step solutions with expert insights and AI powered tools for academic success
Step: 2

Step: 3
Ace Your Homework with AI
Get the answers you need in no time with our AI-driven, step-by-step assistance
Get Started
Financial Accounting The Impact On Decision Makers An Alternative To Debits And Credits
Authors: Gary A. Porter, Curtis L. Norton
3rd Edition
0030335639, 978-0030335631