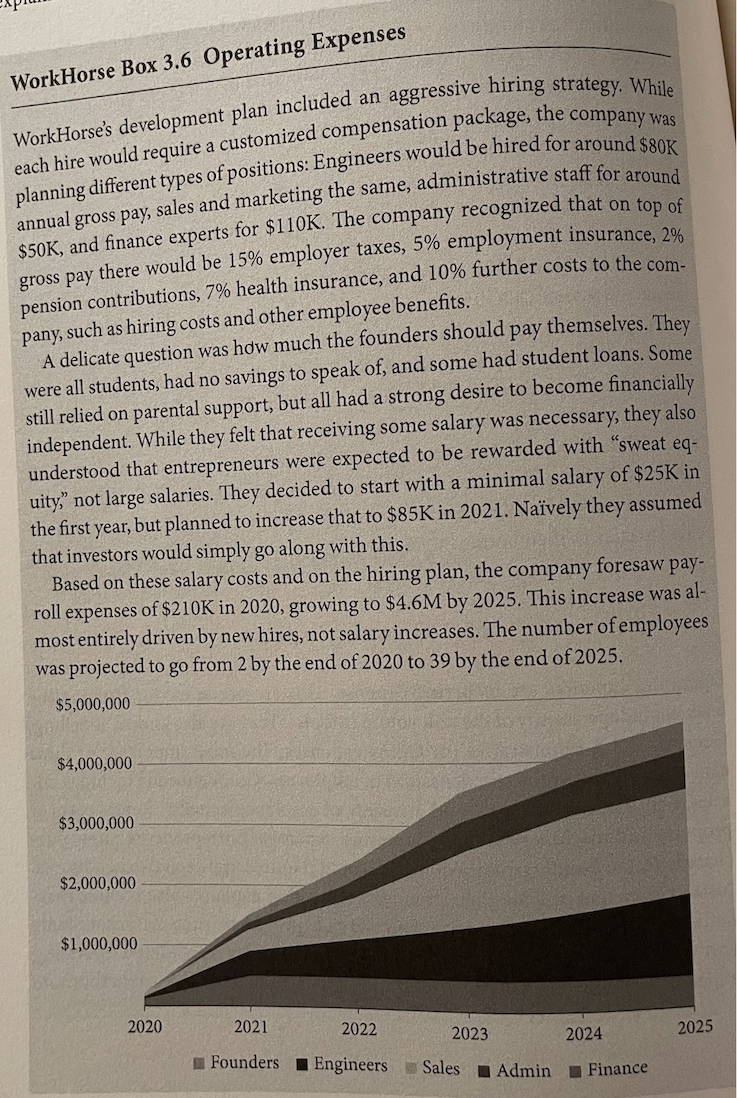
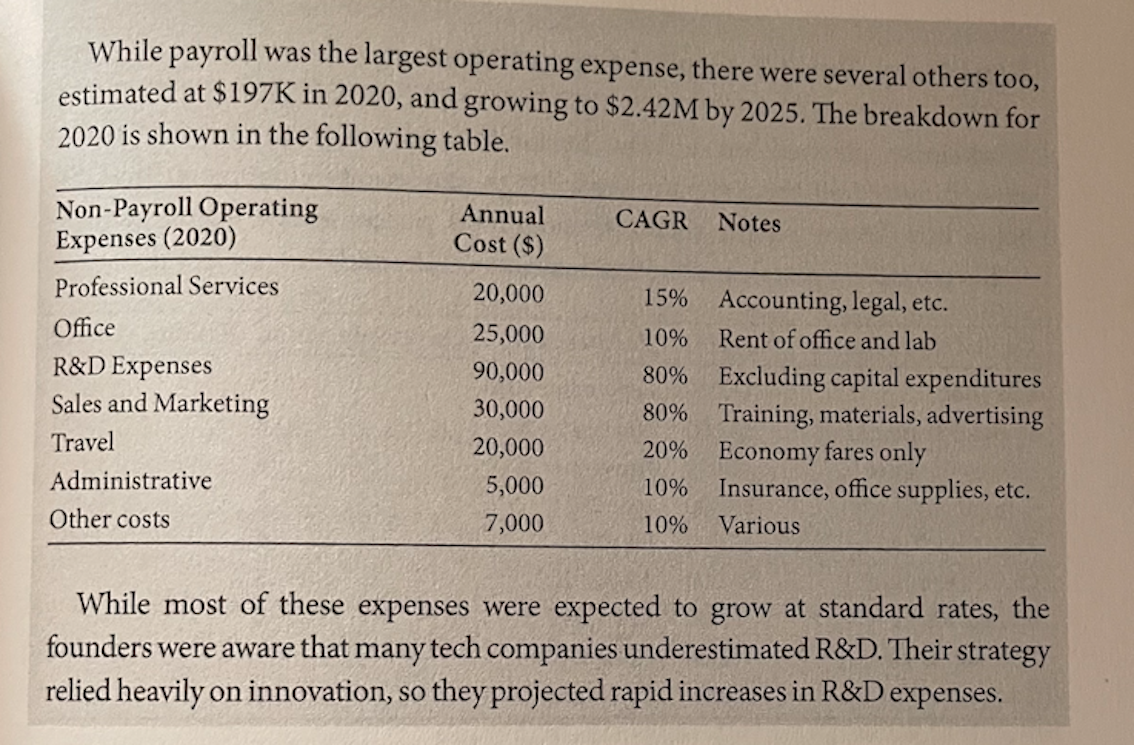
Can Someone Explain to me in full detail if possible how the graph down below was generated from the salaries written in the description and how payroll expense is 210 K at the end of year 1 and 4.6 million at the end of year 5. Im confused because it says that the engineers and sales make $80 000, admin make $50 000 and the financial expert make $110 000, etc. Plus, If you were to have such operating expenses how much would you need from a sole venture capital investor (Hypothetically Speaking) to cover such costs over the five year projection but especially in year 1. Also, If you were to include the other expenses specified in the other image how would that affect the total startup capital that one would need from a sole venture capital investor in the initial term sheet (Hypothetically Speaking). What would a term sheet look like if the venture capital investor were to ask for 25% stake assuming they took a participating preferred stock. Also, what would the hypothetical cap limit and full conversion threshold look like. Please explain in full detail I'm not a business major. Thank you very much.


WorkHorse Box 3.6 Operating Expenses WorkHorse's development plan included an aggressive hiring strategy. While each hire would require a customized compensation package, the company was planning different types of positions: Engineers would be hired for around $80K annual gross pay, sales and marketing the same, administrative staff for around $50K, and finance experts for $110K. The company recognized that on top of gross pay there would be 15% employer taxes, 5% employment insurance, 2% pension contributions, 7% health insurance, and 10% further costs to the com- pany, such as hiring costs and other employee benefits. A delicate question was how much the founders should pay themselves. They were all students, had no savings to speak of, and some had student loans. Some still relied on parental support, but all had a strong desire to become financially independent. While they felt that receiving some salary was necessary, they also understood that entrepreneurs were expected to be rewarded with "sweat eq- uity," not large salaries. They decided to start with a minimal salary of $25K in the first year, but planned to increase that to $85K in 2021. Navely they assumed that investors would simply go along with this. Based on these salary costs and on the hiring plan, the company foresaw pay- roll expenses of $210K in 2020, growing to $4.6M by 2025. This increase was al- most entirely driven by new hires, not salary increases. The number of employees was projected to go from 2 by the end of 2020 to 39 by the end of 2025. $5,000,000 $4,000,000 $3,000,000 $2,000,000 $1,000,000 2020 2021 2022 2023 2024 2025 Founders Engineers Sales Admin Finance While payroll was the largest operating expense, there were several others too, estimated at $197K in 2020, and growing to $2.42M by 2025. The breakdown for 2020 is shown in the following table. Annual Cost ($) CAGR Notes Non-Payroll Operating Expenses (2020) Professional Services Office R&D Expenses Sales and Marketing Travel Administrative Other costs 20,000 25,000 90,000 30,000 20,000 5,000 7,000 15% Accounting, legal, etc. 10% Rent of office and lab 80% Excluding capital expenditures 80% Training, materials, advertising 20% Economy fares only 10% Insurance, office supplies, etc. 10% Various While most of these expenses were expected to grow at standard rates, the founders were aware that many tech companies underestimated R&D. Their strategy relied heavily on innovation, so they projected rapid increases in R&D expenses. WorkHorse Box 3.6 Operating Expenses WorkHorse's development plan included an aggressive hiring strategy. While each hire would require a customized compensation package, the company was planning different types of positions: Engineers would be hired for around $80K annual gross pay, sales and marketing the same, administrative staff for around $50K, and finance experts for $110K. The company recognized that on top of gross pay there would be 15% employer taxes, 5% employment insurance, 2% pension contributions, 7% health insurance, and 10% further costs to the com- pany, such as hiring costs and other employee benefits. A delicate question was how much the founders should pay themselves. They were all students, had no savings to speak of, and some had student loans. Some still relied on parental support, but all had a strong desire to become financially independent. While they felt that receiving some salary was necessary, they also understood that entrepreneurs were expected to be rewarded with "sweat eq- uity," not large salaries. They decided to start with a minimal salary of $25K in the first year, but planned to increase that to $85K in 2021. Navely they assumed that investors would simply go along with this. Based on these salary costs and on the hiring plan, the company foresaw pay- roll expenses of $210K in 2020, growing to $4.6M by 2025. This increase was al- most entirely driven by new hires, not salary increases. The number of employees was projected to go from 2 by the end of 2020 to 39 by the end of 2025. $5,000,000 $4,000,000 $3,000,000 $2,000,000 $1,000,000 2020 2021 2022 2023 2024 2025 Founders Engineers Sales Admin Finance While payroll was the largest operating expense, there were several others too, estimated at $197K in 2020, and growing to $2.42M by 2025. The breakdown for 2020 is shown in the following table. Annual Cost ($) CAGR Notes Non-Payroll Operating Expenses (2020) Professional Services Office R&D Expenses Sales and Marketing Travel Administrative Other costs 20,000 25,000 90,000 30,000 20,000 5,000 7,000 15% Accounting, legal, etc. 10% Rent of office and lab 80% Excluding capital expenditures 80% Training, materials, advertising 20% Economy fares only 10% Insurance, office supplies, etc. 10% Various While most of these expenses were expected to grow at standard rates, the founders were aware that many tech companies underestimated R&D. Their strategy relied heavily on innovation, so they projected rapid increases in R&D expenses


