Answered step by step
Verified Expert Solution
Question
1 Approved Answer
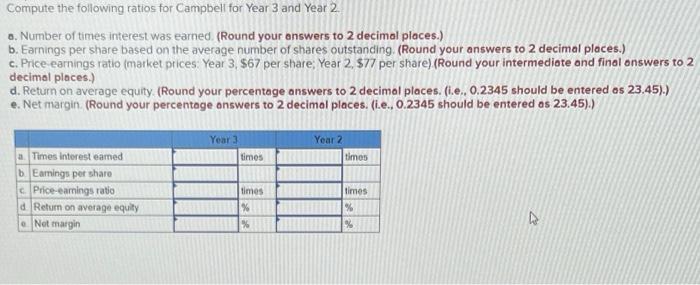
Can someone fill in the chart? Campbell Company's income statement information follows: Net sales Income before interest and taxes Net income after taxes Interest expense
Can someone fill in the chart? 

Campbell Company's income statement information follows: Net sales Income before interest and taxes Net income after taxes Interest expense Stockholders' equity, December 31 (Year 1: $190,000) Common stock, December 31 Year 3 $425,000 111,000 55,000 8,850 309,000 197,500 Year 2 $258,000 81,000 63,300 7,700 238,000 175,000 The average number of shares outstanding was 7,900 for Year 3 and 7,000 for Year 2 Compute the following ratios for Campbell for Year 3 and Year 2. a. Number of times interest was earned (Round your answers to 2 decimal places.) b. Earnings per share based on the average number of shares outstanding (Round your answers to 2 decimal places.) c. Price earnings ratio (market prices: Year 3, $67 per share Year 2, 577 per share) (Round your intermediate and final onswers to 2 12,8 decimal places.) d. Return on average equity (Round your percentage answers to 2 decimal places. (.e., 0.2345 should be entered as 23.45).) e. Net margin (Round your percentage answers to 2 decimal places. (i.e., 0.2345 should be entered os 23.45).) Year 3 Year 2 times times a Times interest earned b. Eamings per share c. Price-camnings ratio Return on average equity Net margin times times % % 

Step by Step Solution
There are 3 Steps involved in it
Step: 1

Get Instant Access to Expert-Tailored Solutions
See step-by-step solutions with expert insights and AI powered tools for academic success
Step: 2

Step: 3

Ace Your Homework with AI
Get the answers you need in no time with our AI-driven, step-by-step assistance
Get Started


