Answered step by step
Verified Expert Solution
Question
1 Approved Answer
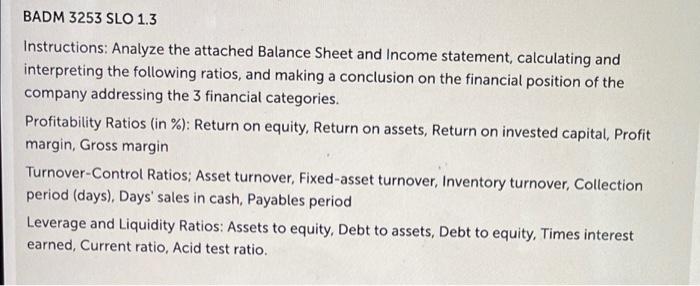
can someone help and please show all work in excel BADM 3253 SLO 1.3 Instructions: Analyze the attached Balance Sheet and Income statement, calculating and
can someone help and please show all work in excel 


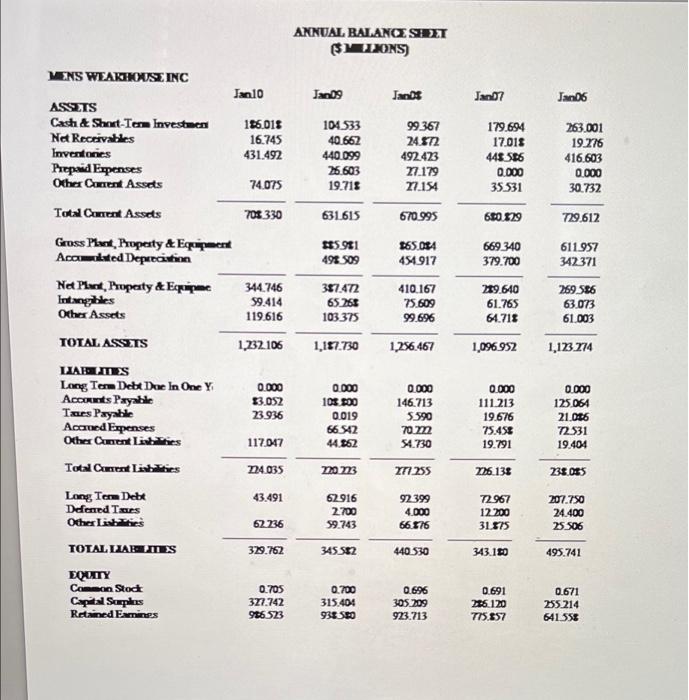
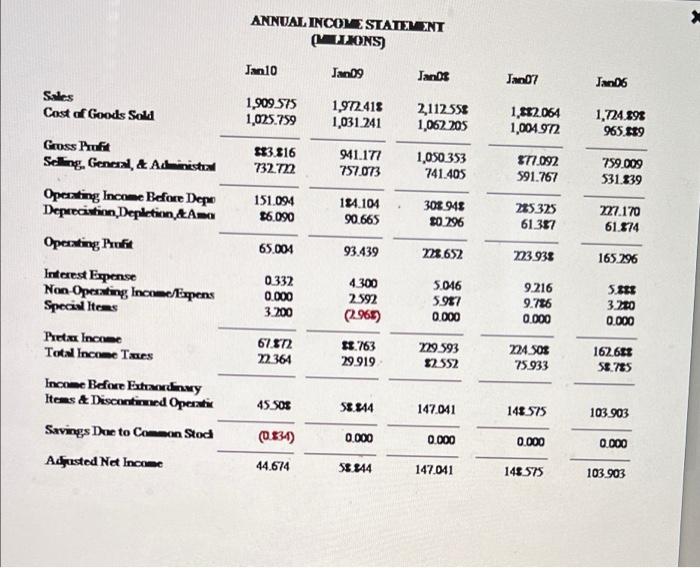
BADM 3253 SLO 1.3 Instructions: Analyze the attached Balance Sheet and Income statement, calculating and interpreting the following ratios, and making a conclusion on the financial position of the company addressing the 3 financial categories. Profitability Ratios (in %): Return on equity, Return on assets, Return on invested capital, Profit margin, Gross margin Turnover-Control Ratios; Asset turnover, Fixed-asset turnover, Inventory turnover, Collection period (days), Days' sales in cash, Payables period Leverage and Liquidity Ratios: Assets to equity, Debt to assets, Debt to equity, Times interest earned, Current ratio, Acid test ratio. ANNUAL BALANCE SHEET SLIONS) MENS WEAKHOUSE INC Jaolo Jang Jandt Jan 7 Jan 06 ASSETS Cash & Short-Term Investmen Net Receivables Inventories Prepaid Expenses Other Content Assets 136.018 16.745 431.492 104533 40.662 440 099 26.603 19.718 99.367 24572 492423 27.179 77.154 179.694 17.01$ 44856 0.000 35331 263.001 19.276 416,603 0.000 30.732 74.075 Total Cement Assets 708330 631615 670 995 60.579 729.612 15901 498 509 165.084 451.917 669 340 379.700 611.957 342371 Gross Plant Property & Equipment Aconited Deprecision Net Planet, Property & Equipm Intangibles Other Assets 344.746 59.414 119.616 387.472 65 266 103375 410.167 75.609 99.696 219.610 61.765 64.718 269.526 63.073 61.003 1.32.106 1,187.730 1,256,467 1,096.952 1,123.774 0.000 13.052 33936 TOTAL ASSETS LIABLES Long Term Debt Dee In One Y. Accounts Payabile Tars Payable Aconued Expenses Other ContentLisbilities Total Convent Lisbilities Long Term Debe Deened Twes Other Lisbites TOTAL LIABILIES 0.000 103.10 0.019 66 542 44 062 0.000 146.713 5590 70 m 54.730 0.000 111.213 19.676 75.458 19.791 0.000 125 061 21.016 72.31 19.404 117047 224.035 nom I255 76.139 28.085 43.491 62916 2700 59.743 92 399 4.000 66.576 72967 12 200 31.375 207.750 24.400 25 506 62236 329.762 345 552 440530 343.180 495.741 EQUITY Common Stock Capital Supplies Retained Emines 0.705 377.742 986 523 0.700 315.404 930 SEO 0.696 305. 209 923.713 0.691 26.120 775.857 0.671 255.214 641 558 ANNUAL INCOME STATEMENT (MLLONS) Jan 10 Jan09 Janos J2007 Janda Sales Cost of Goods Sold 1,909 575 1,025,759 1.972418 1,031.241 2,112558 1,062 205 1,82064 1,004972 1,724198 965.109 Gross Profit Seling. General & Anistu $3816 732.7 941.177 757.073 1,050.353 741.405 $17.092 591.767 759.009 531.839 151,094 16.090 184.104 90.665 304 948 30 296 285325 61.387 27.170 61.374 65.001 93.439 228 652 73938 165 296 0332 0.000 3.200 4.300 2592 (2.965) 5.046 5.987 0.000 9.216 9.776 0.000 Operating Income Before Depe Deprecation Depletion &Ama Operating Profit Interest Expense Non-Operating Income Expens Special Items Preta Income Total Income Taes Income Before Extraordinwy Items & Discontinued Operatin Savings Due to Common Stod Adjusted Net Income 5.363 3.270 0.000 67.572 m 364 11.763 29.919 719 593 12.382 Z24. SOS 75.933 162.613 58.785 45 50$ S8844 147.041 148575 103.903 (0.834) 0.000 0.000 0.000 0.000 44.674 58.444 147.041 148 575 103 903 BADM 3253 SLO 1.3 Instructions: Analyze the attached Balance Sheet and Income statement, calculating and interpreting the following ratios, and making a conclusion on the financial position of the company addressing the 3 financial categories. Profitability Ratios (in %): Return on equity, Return on assets, Return on invested capital, Profit margin, Gross margin Turnover-Control Ratios; Asset turnover, Fixed-asset turnover, Inventory turnover, Collection period (days), Days' sales in cash, Payables period Leverage and Liquidity Ratios: Assets to equity, Debt to assets, Debt to equity, Times interest earned, Current ratio, Acid test ratio. ANNUAL BALANCE SHEET SLIONS) MENS WEAKHOUSE INC Jaolo Jang Jandt Jan 7 Jan 06 ASSETS Cash & Short-Term Investmen Net Receivables Inventories Prepaid Expenses Other Content Assets 136.018 16.745 431.492 104533 40.662 440 099 26.603 19.718 99.367 24572 492423 27.179 77.154 179.694 17.01$ 44856 0.000 35331 263.001 19.276 416,603 0.000 30.732 74.075 Total Cement Assets 708330 631615 670 995 60.579 729.612 15901 498 509 165.084 451.917 669 340 379.700 611.957 342371 Gross Plant Property & Equipment Aconited Deprecision Net Planet, Property & Equipm Intangibles Other Assets 344.746 59.414 119.616 387.472 65 266 103375 410.167 75.609 99.696 219.610 61.765 64.718 269.526 63.073 61.003 1.32.106 1,187.730 1,256,467 1,096.952 1,123.774 0.000 13.052 33936 TOTAL ASSETS LIABLES Long Term Debt Dee In One Y. Accounts Payabile Tars Payable Aconued Expenses Other ContentLisbilities Total Convent Lisbilities Long Term Debe Deened Twes Other Lisbites TOTAL LIABILIES 0.000 103.10 0.019 66 542 44 062 0.000 146.713 5590 70 m 54.730 0.000 111.213 19.676 75.458 19.791 0.000 125 061 21.016 72.31 19.404 117047 224.035 nom I255 76.139 28.085 43.491 62916 2700 59.743 92 399 4.000 66.576 72967 12 200 31.375 207.750 24.400 25 506 62236 329.762 345 552 440530 343.180 495.741 EQUITY Common Stock Capital Supplies Retained Emines 0.705 377.742 986 523 0.700 315.404 930 SEO 0.696 305. 209 923.713 0.691 26.120 775.857 0.671 255.214 641 558 ANNUAL INCOME STATEMENT (MLLONS) Jan 10 Jan09 Janos J2007 Janda Sales Cost of Goods Sold 1,909 575 1,025,759 1.972418 1,031.241 2,112558 1,062 205 1,82064 1,004972 1,724198 965.109 Gross Profit Seling. General & Anistu $3816 732.7 941.177 757.073 1,050.353 741.405 $17.092 591.767 759.009 531.839 151,094 16.090 184.104 90.665 304 948 30 296 285325 61.387 27.170 61.374 65.001 93.439 228 652 73938 165 296 0332 0.000 3.200 4.300 2592 (2.965) 5.046 5.987 0.000 9.216 9.776 0.000 Operating Income Before Depe Deprecation Depletion &Ama Operating Profit Interest Expense Non-Operating Income Expens Special Items Preta Income Total Income Taes Income Before Extraordinwy Items & Discontinued Operatin Savings Due to Common Stod Adjusted Net Income 5.363 3.270 0.000 67.572 m 364 11.763 29.919 719 593 12.382 Z24. SOS 75.933 162.613 58.785 45 50$ S8844 147.041 148575 103.903 (0.834) 0.000 0.000 0.000 0.000 44.674 58.444 147.041 148 575 103 903 


Step by Step Solution
There are 3 Steps involved in it
Step: 1

Get Instant Access to Expert-Tailored Solutions
See step-by-step solutions with expert insights and AI powered tools for academic success
Step: 2

Step: 3

Ace Your Homework with AI
Get the answers you need in no time with our AI-driven, step-by-step assistance
Get Started


