

Question
Can someone help me with BA project? I just need the Operating Returns (ROE, ROA) in Part one and conclusion in part two. The objective
Can someone help me with BA project? I just need the Operating Returns (ROE, ROA) in Part one and conclusion in part two.
The objective of the financial analysis research project are to enable you to prepare and produce a comprehensive financial analysis of two publicly-traded corporation. Using the two companies (Visa and Mastercard) you will work as a team to compare these two competitors and provide a critical analysis of these two corporations financial ratios to make recommendations regarding investing in either of these companies.
- First, calculate the required financial ratios for each company (Visa and Mastercard) using their annual data from 2018, and present in MS Excel.
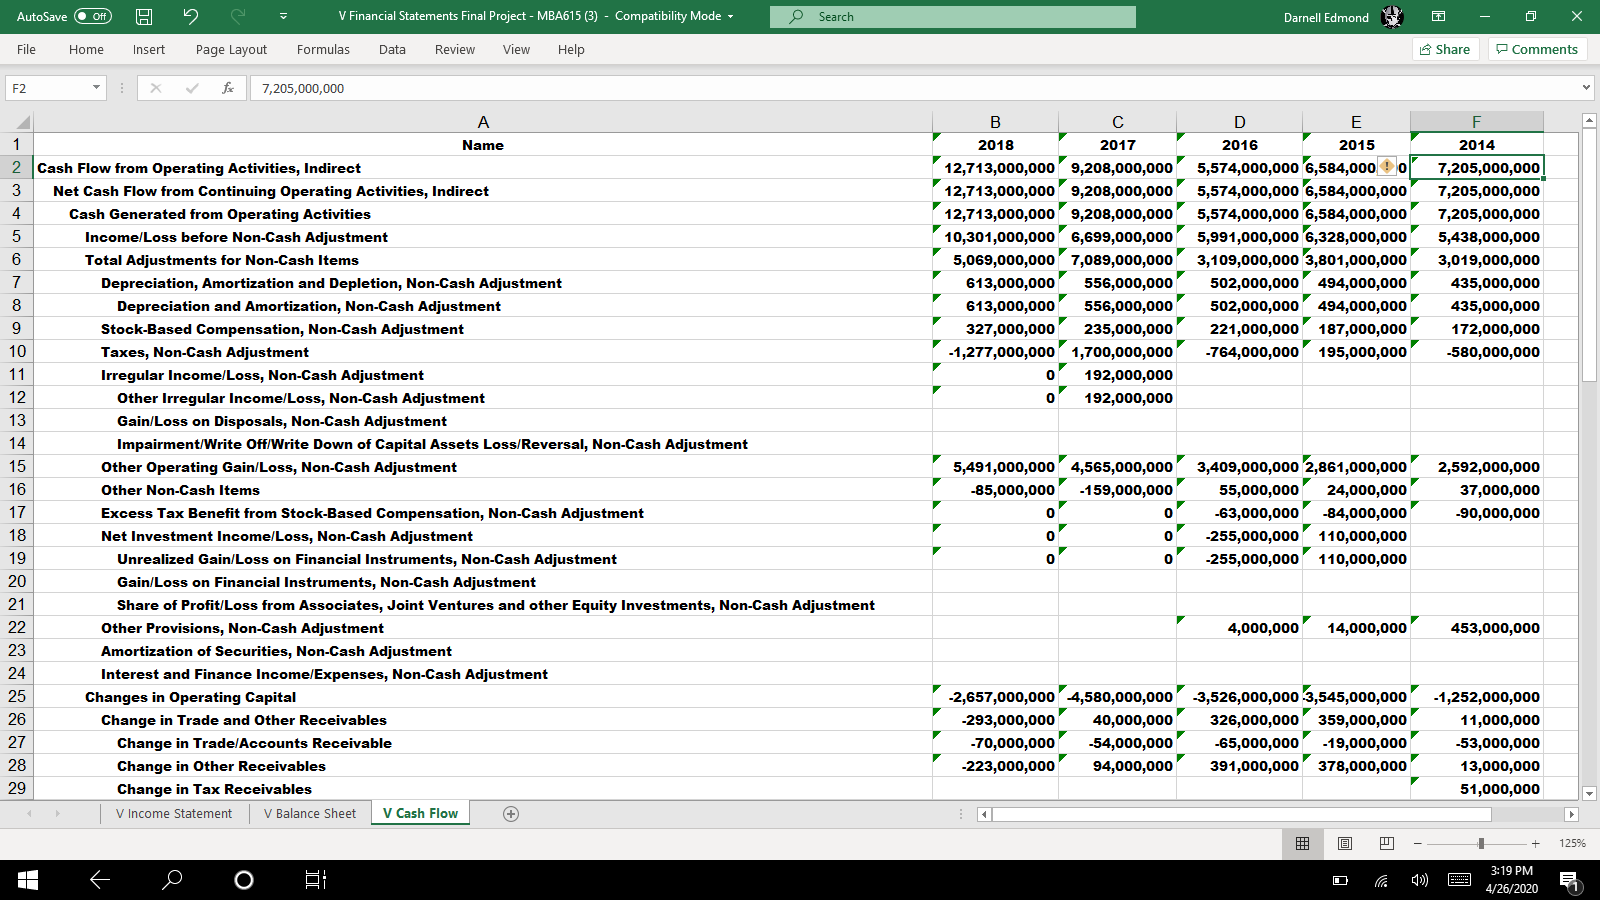
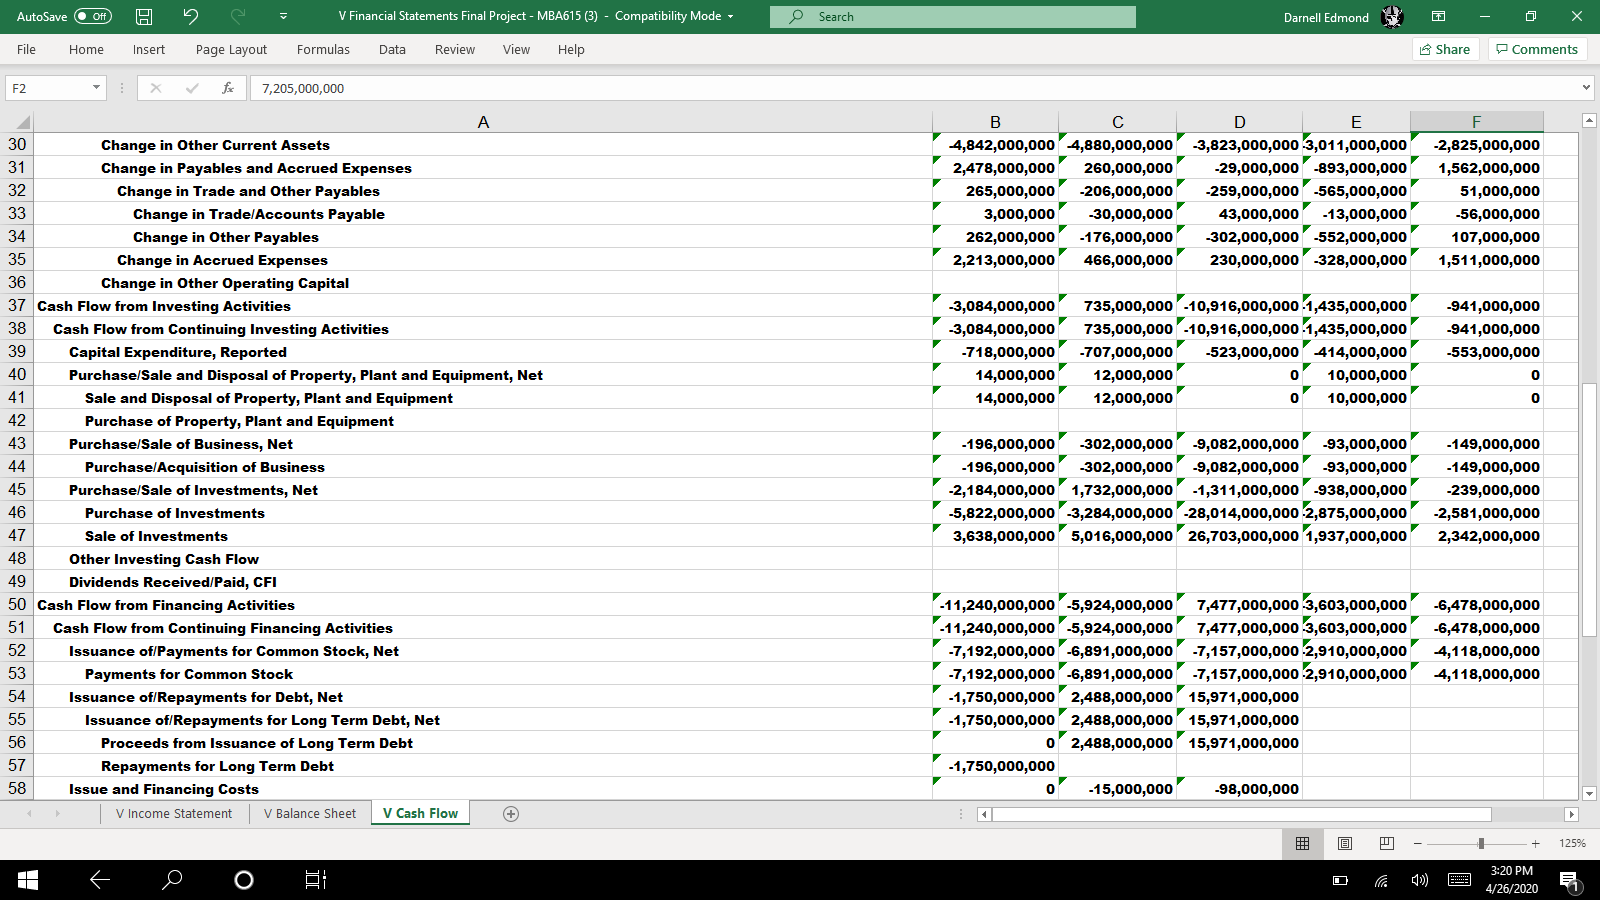
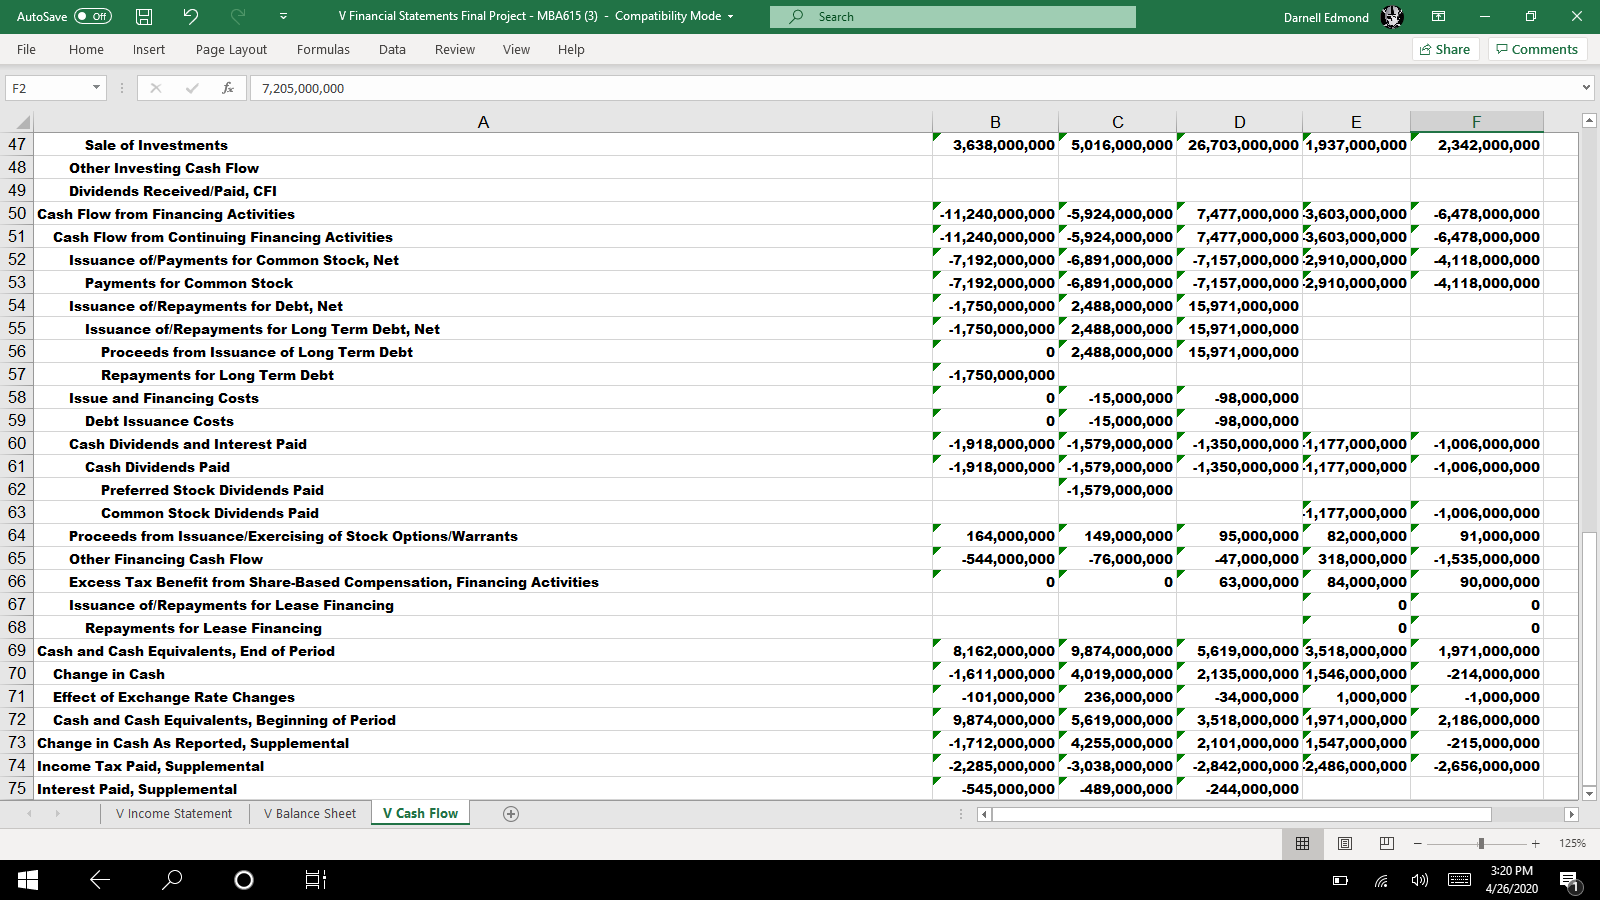
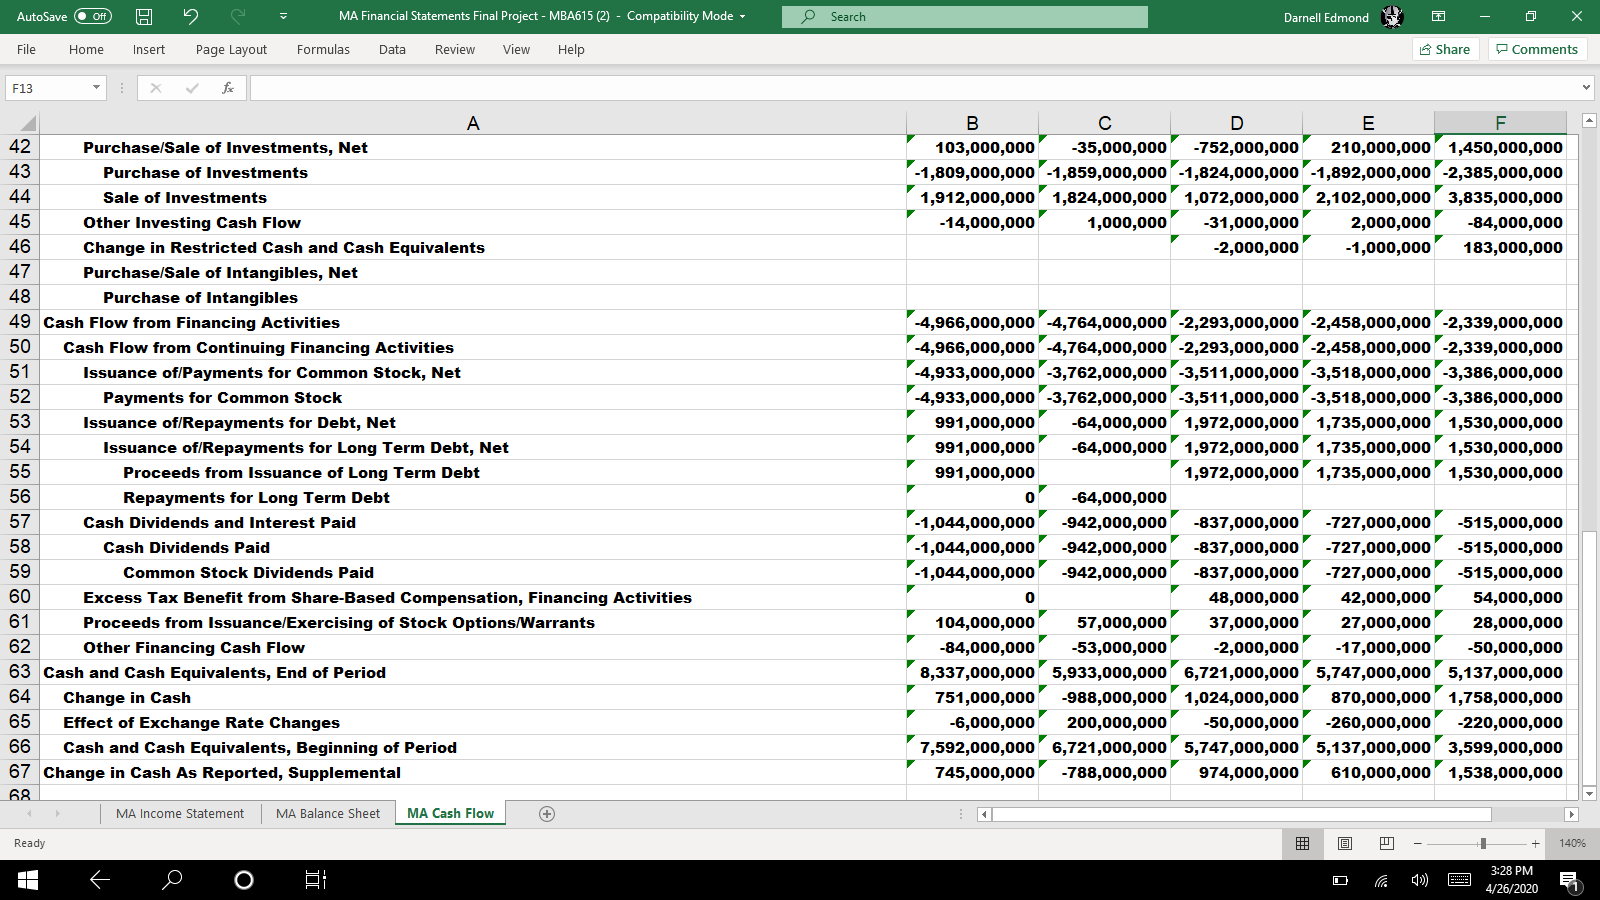
- V Financial Statements Final Project
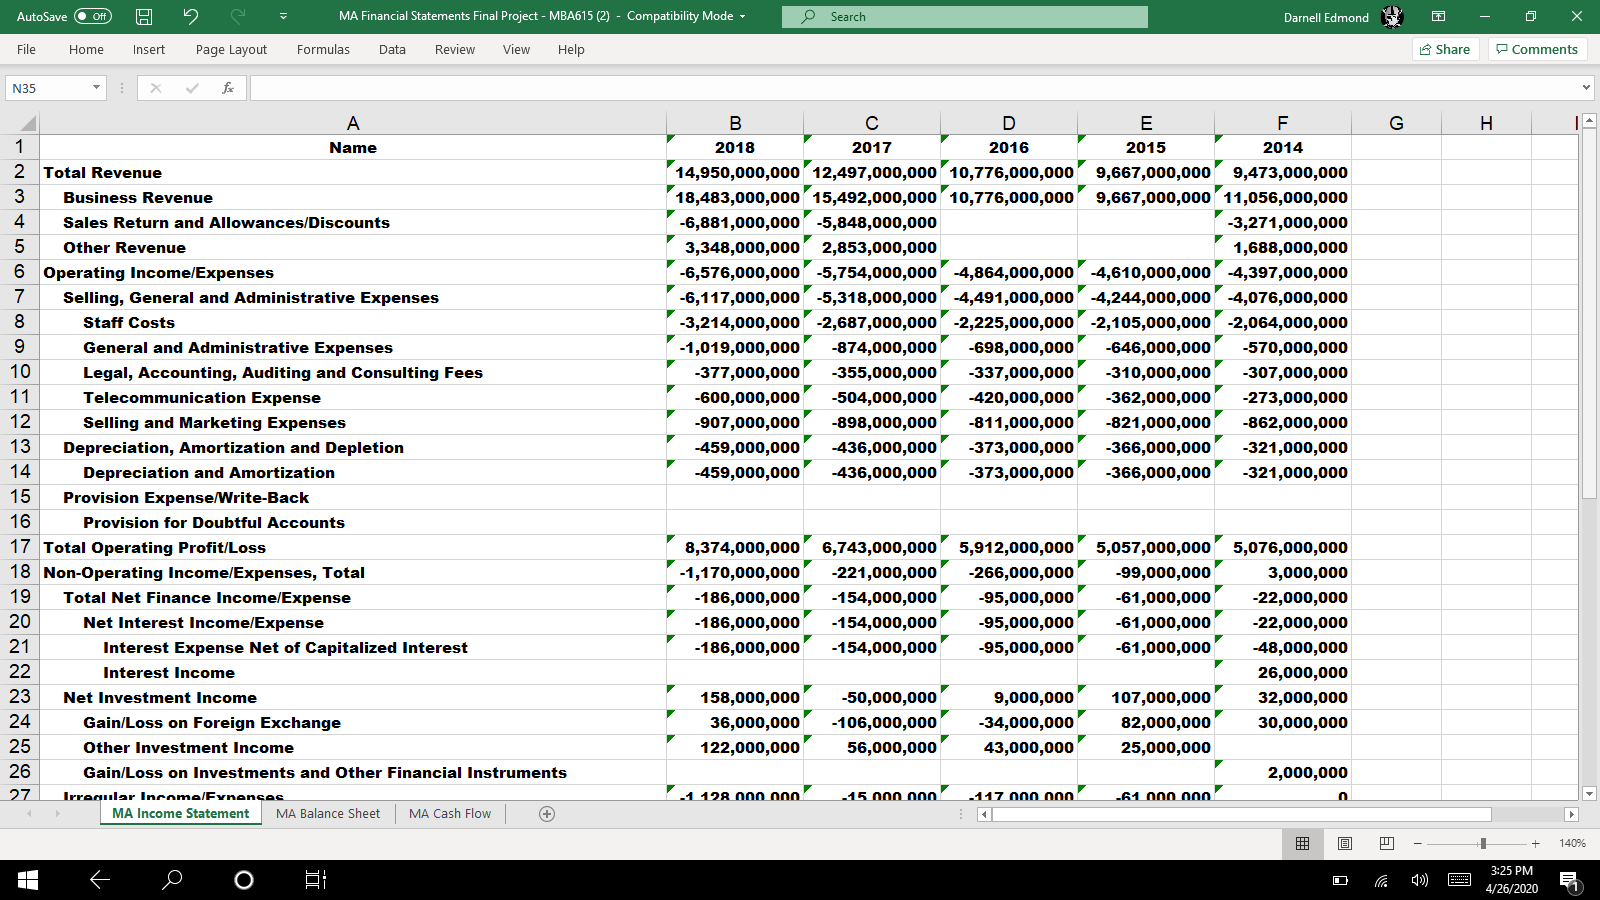
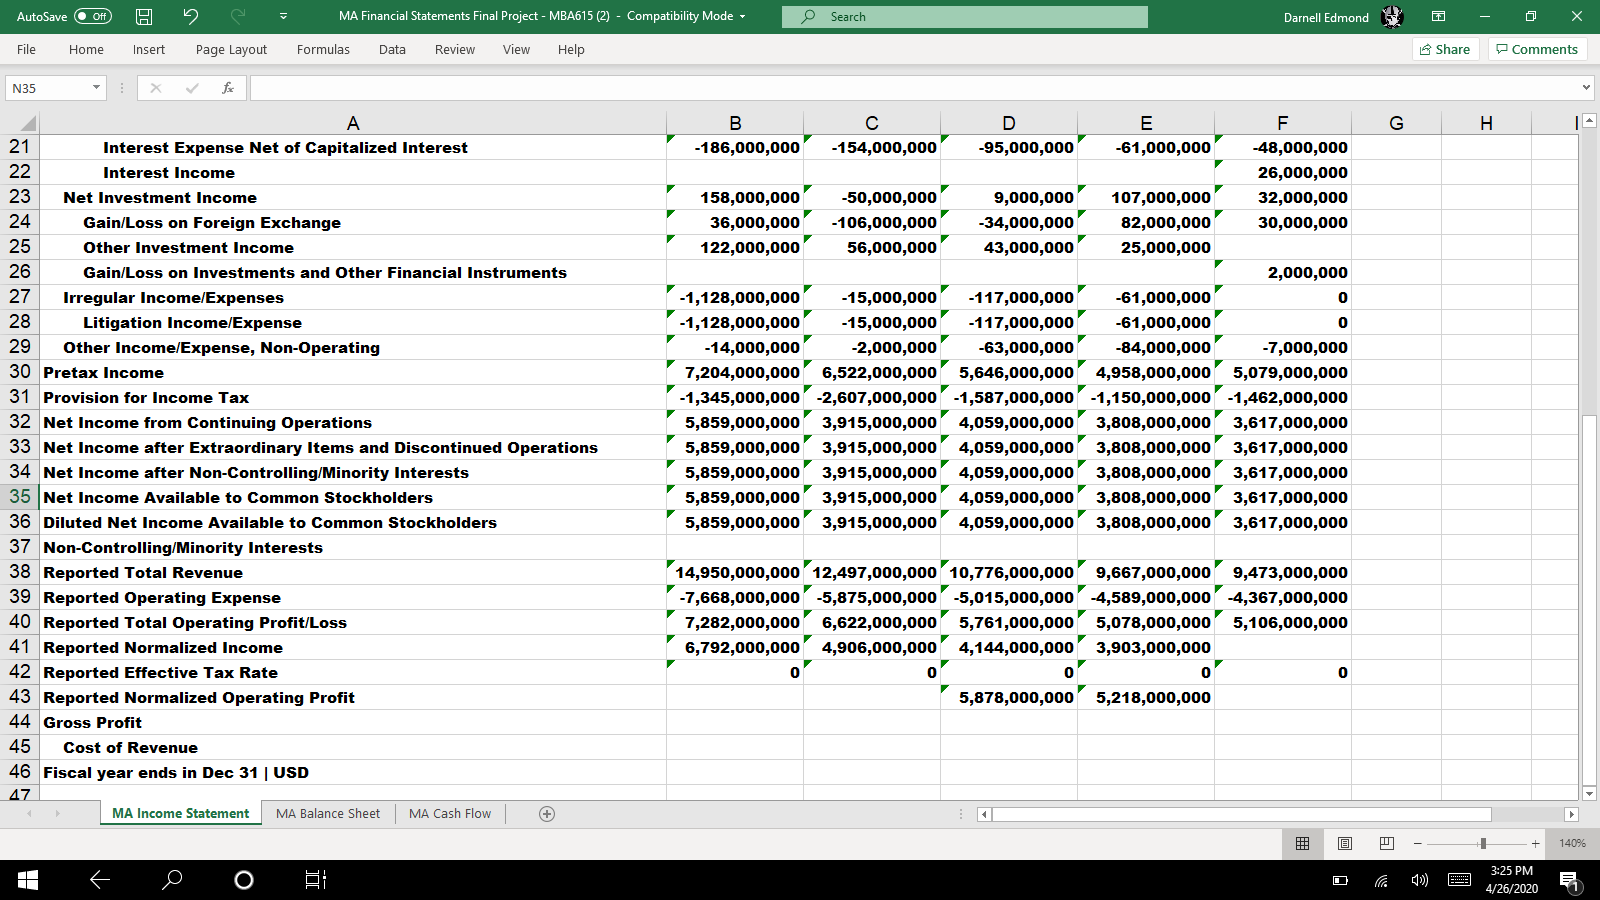
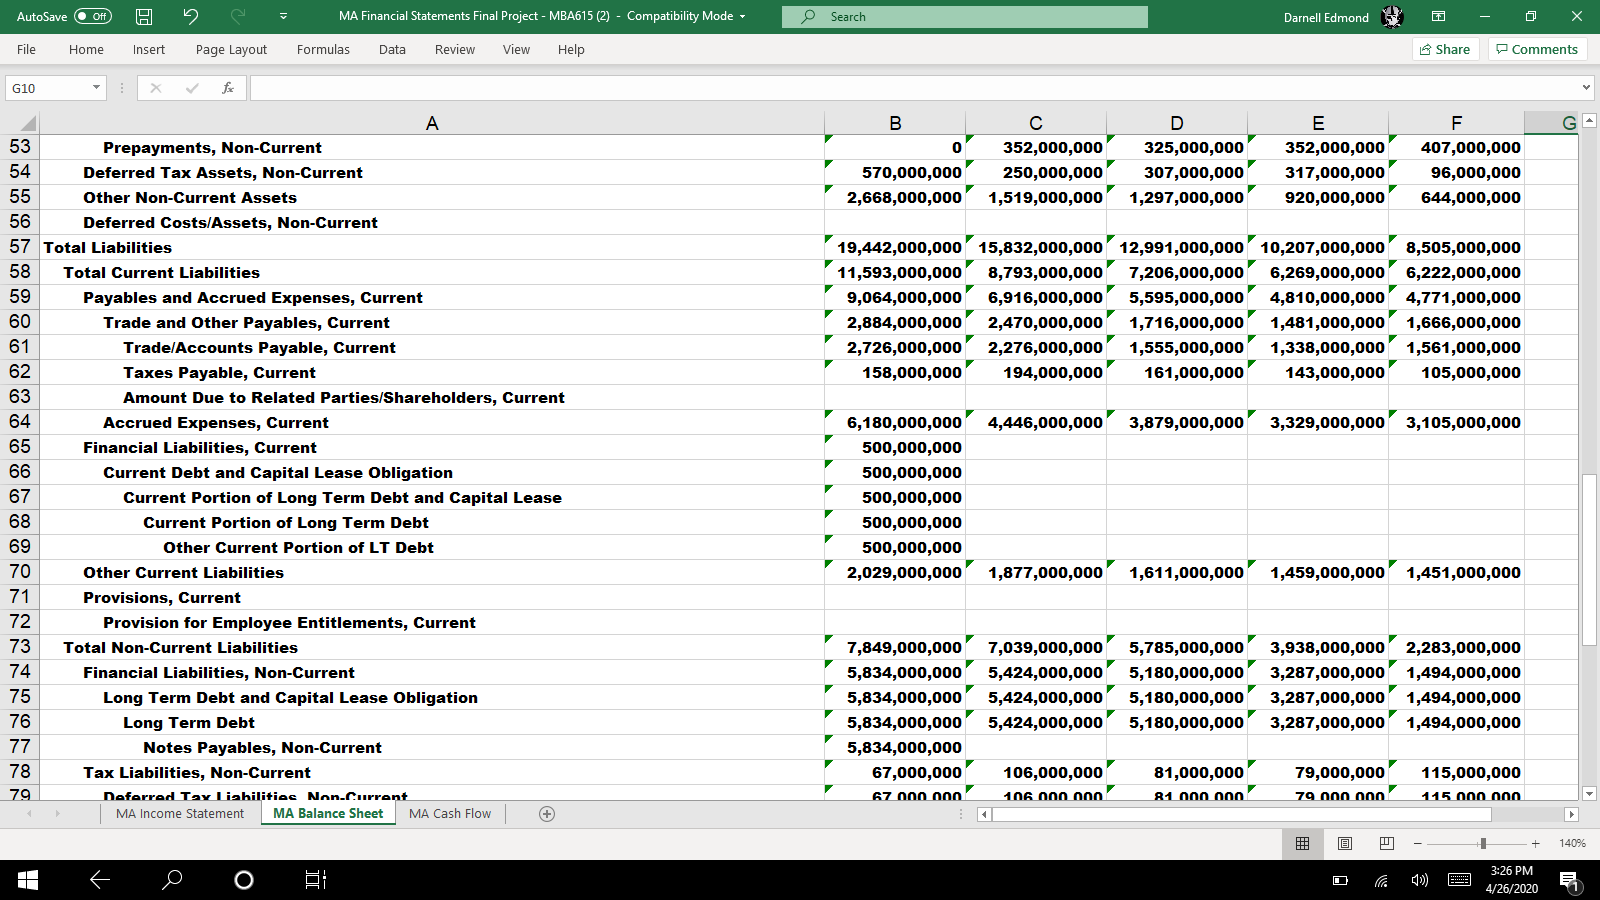
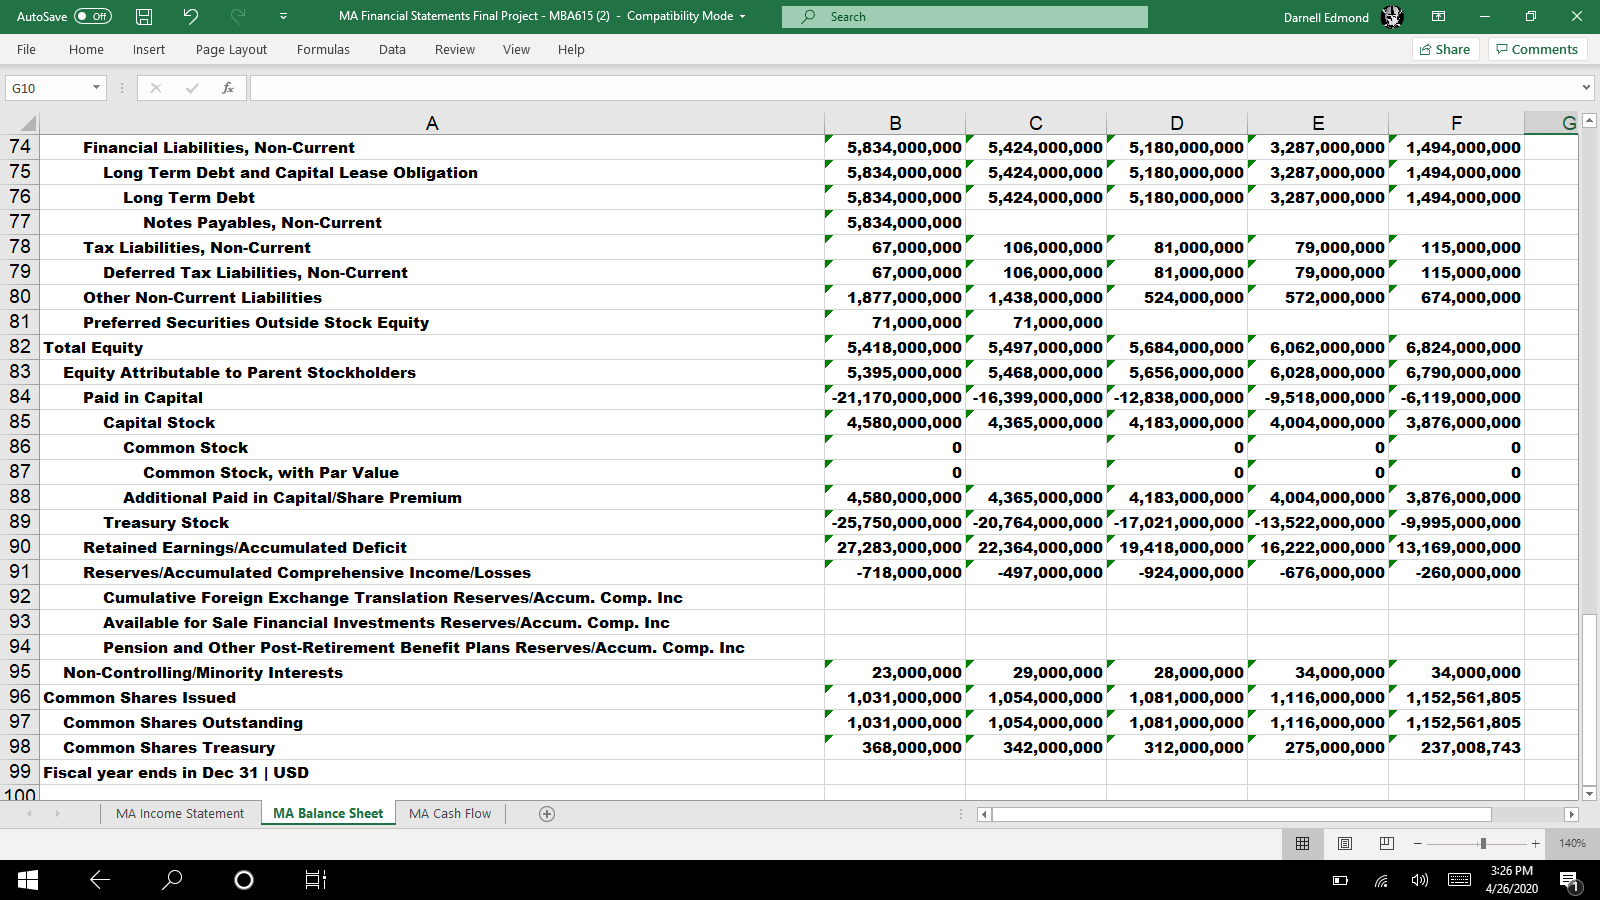
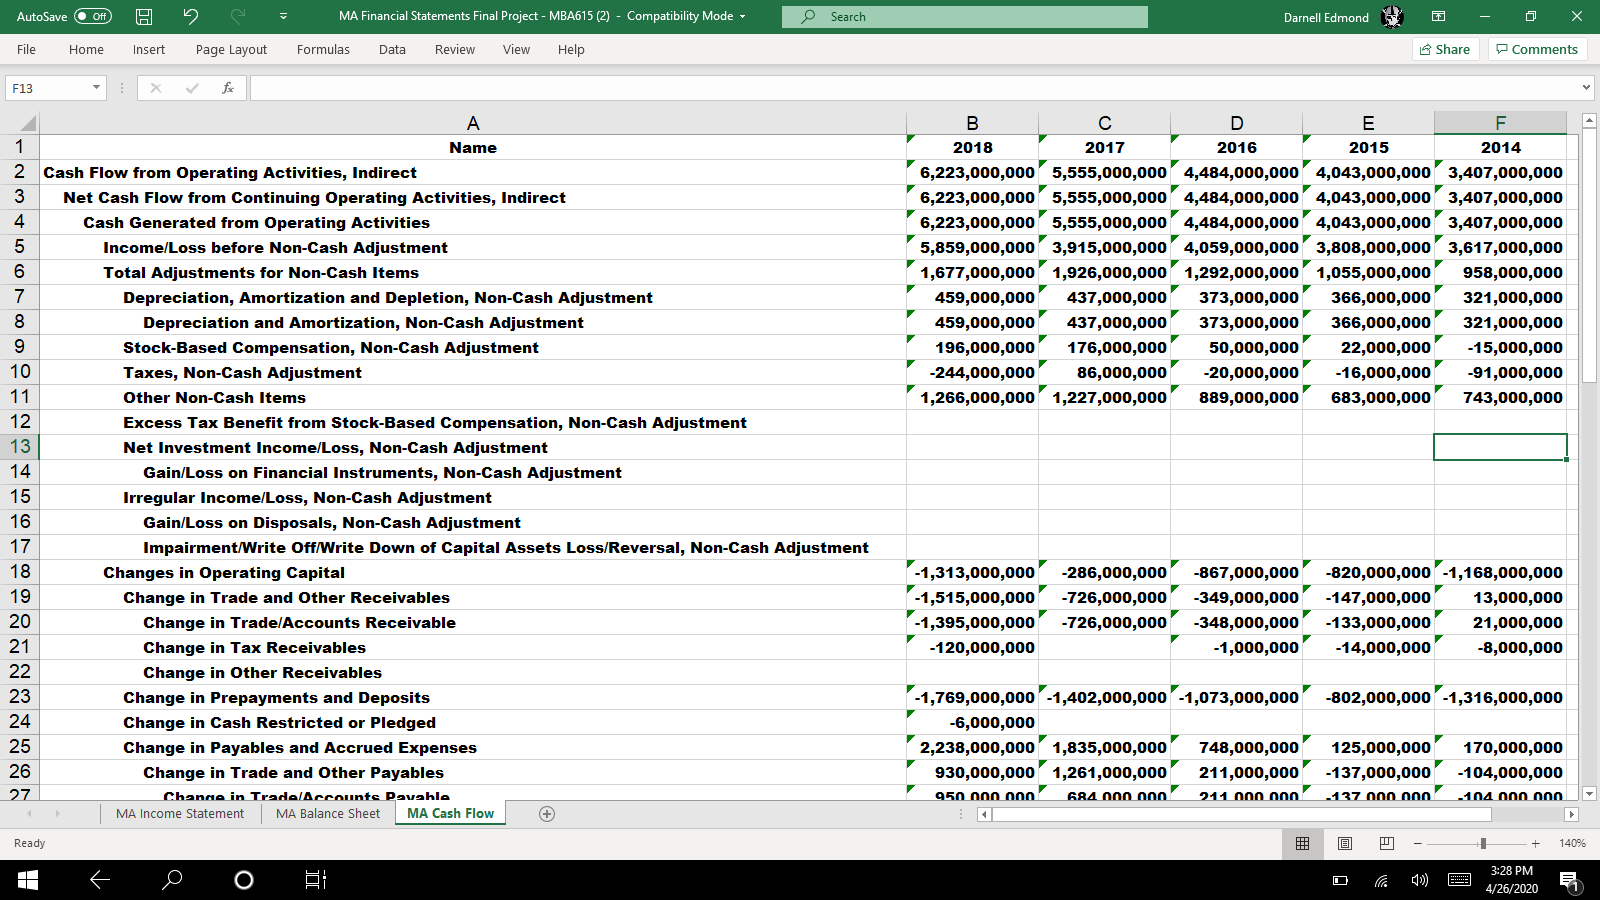
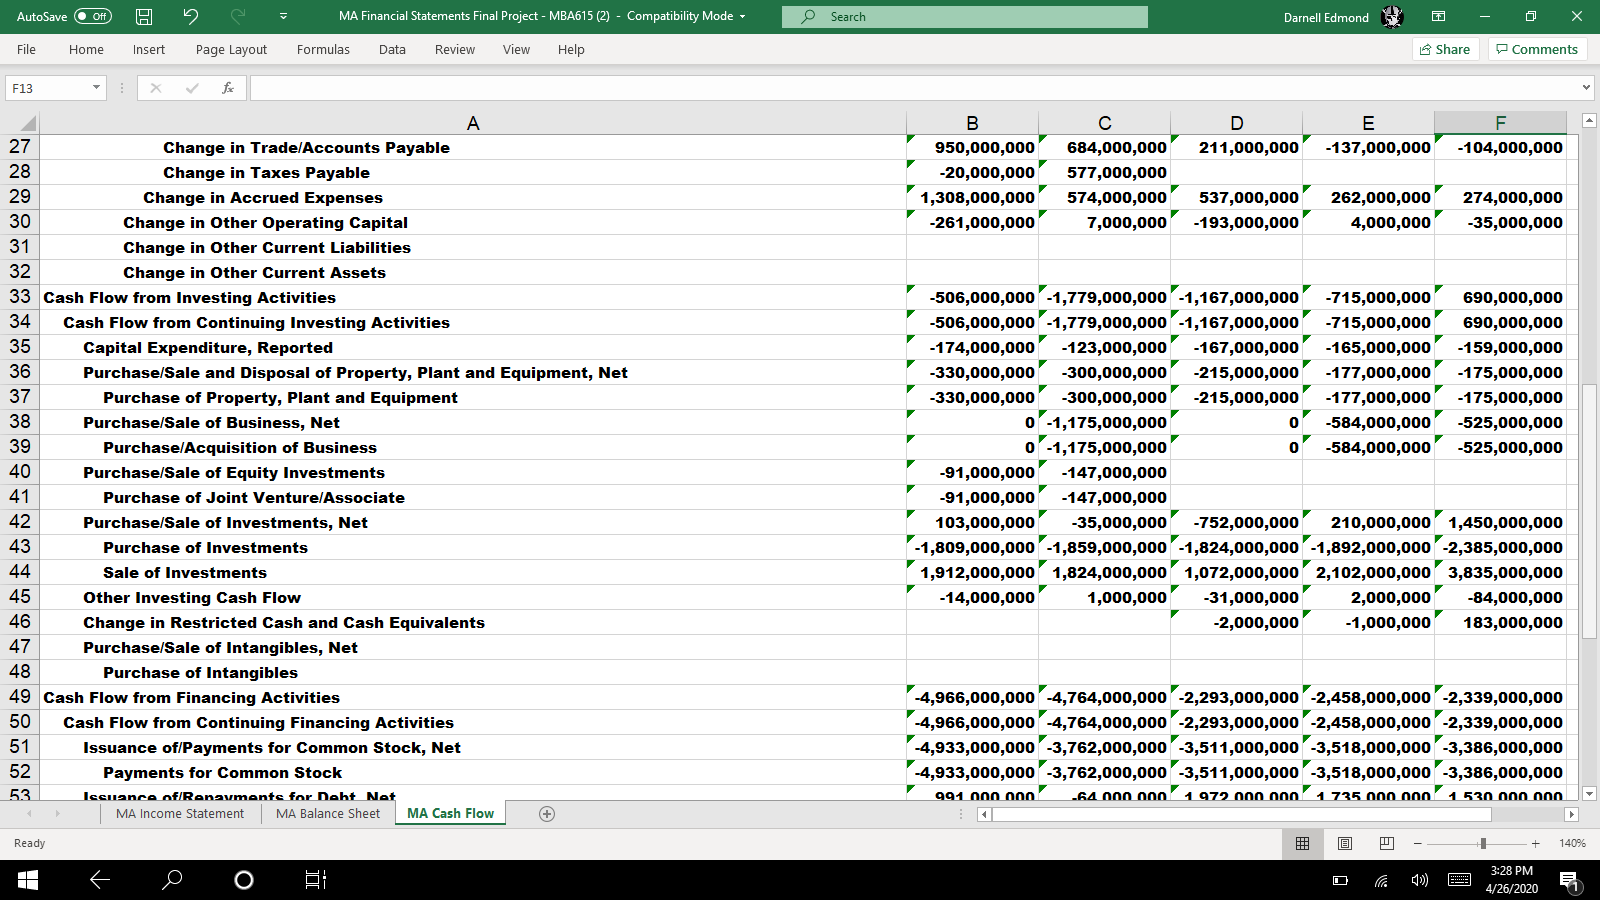
- MA Financial Statements Final Project
- Second, write a financial analysis report that utilizes your financial ratios and supported with written analysis, interpretation, and evaluation of the data. Your teams analysis should be focused on the main theme:
- Would you invest your financial capital in either firm as a shareholder?
Excel Financial Ratios
For this project you will prepare financial ratios in MS Excel using the accounting statements provided. Teams must provide the calculations for the following ratios for each company using the 2018 annual data. Calculations must be performed and submitted in an MS Excel spreadsheet.
- Profitability Ratios
- Gross Margin
- Operating Margin
- Net Profit Margin
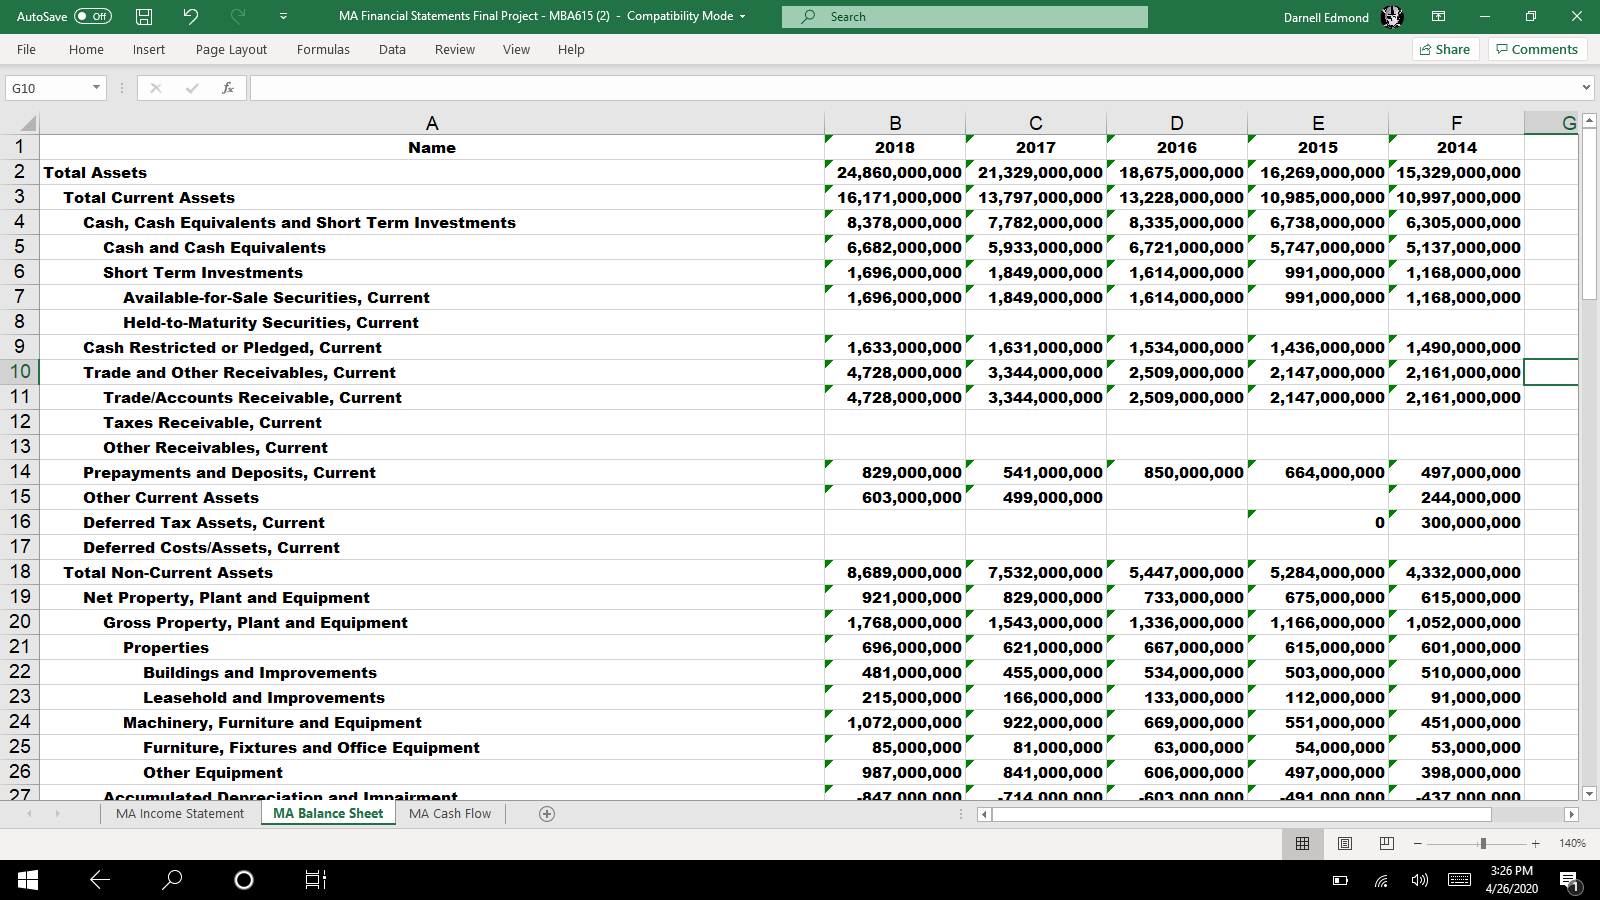
- Liquidity Ratios
- Current Ratio
- Cash Ratio
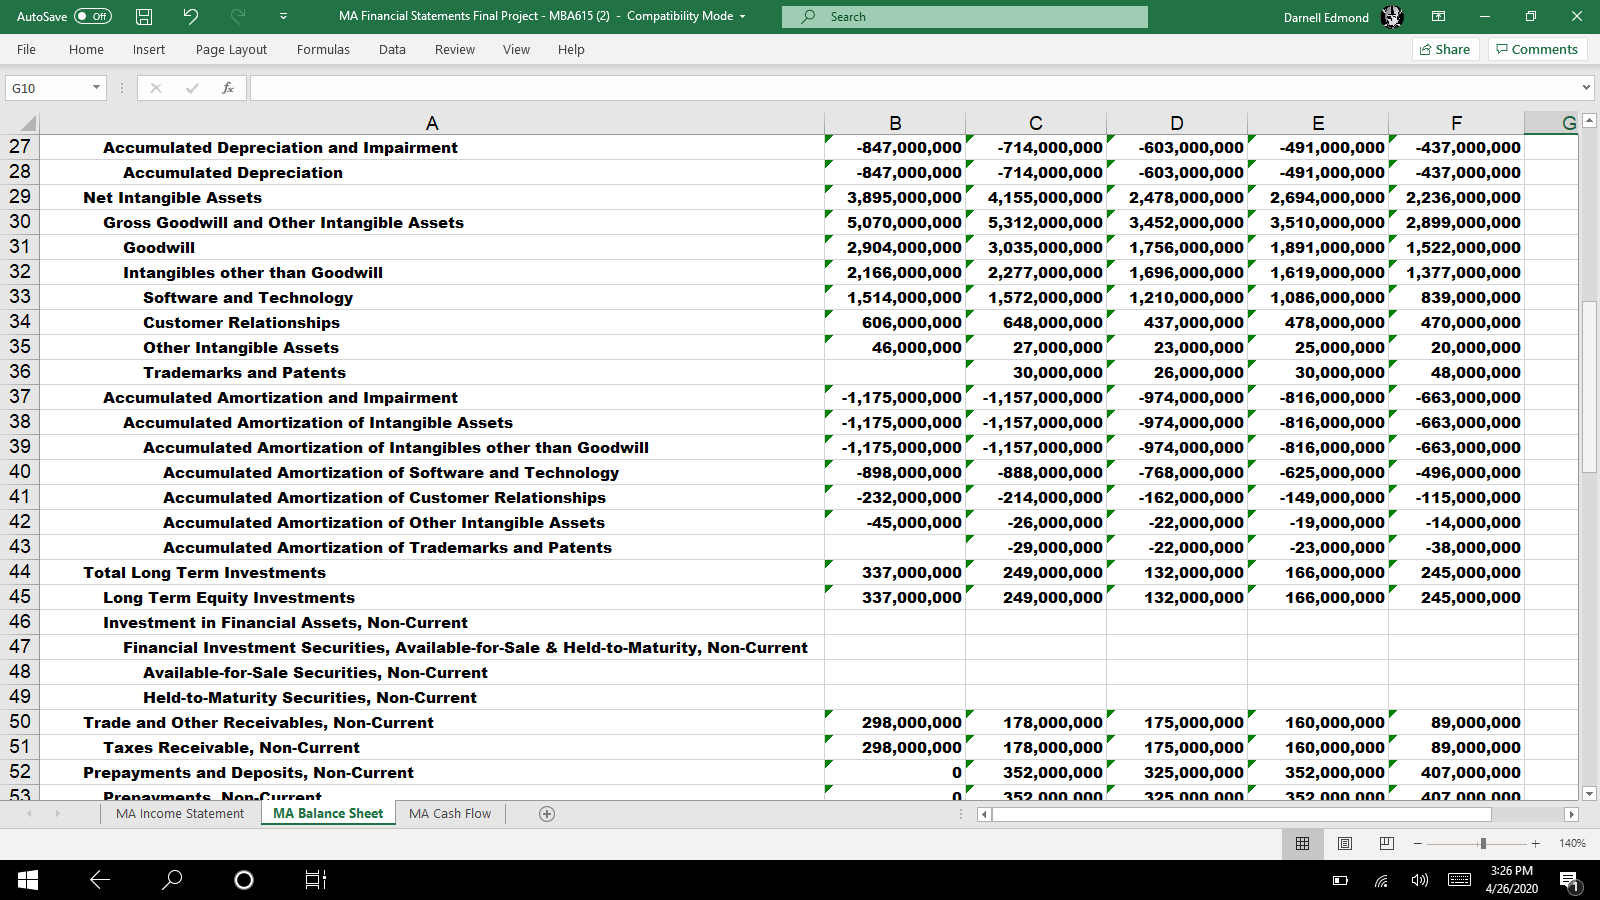
- Leverage Ratios
- Debt to Equity
- Operating Returns
- ROE
- ROA
Project Deliverables
For this project you and your team will prepare financial ratios using the accounting statements provided.
1. You will prepare an Excel document which provides the calculations for the ratios required for the project. The Excel document should clearly identify each company and their specific ratio calculations.
2. You will submit a written analysis of your findings. This final analysis should be written as a professional stock analysis of these two competitors and utilize supporting evidence in your analysis (citations and references). The final written analysis must follow APA formatting and should be no more than 15 pages (including charts and references). The analysis should include:
- Analysis of the two businesses and a discussion of the payments industry, including but not limited to, strengths of these businesses, opportunities moving forward, potential threats to their business models.
- Critical analysis of each of the main ratio calculations related to each company. This critical analysis should include the calculations, results, an explanation of the importance of the ratio, and an analysis of which company has an advantage based upon the calculations. This analysis should include graphs and figures to supplement your written analysis.
- Clear conclusion which summarizes the advantages and disadvantages for each company, with an ultimate answer related to which company you would choose to invest using clear and convincing reasoning.
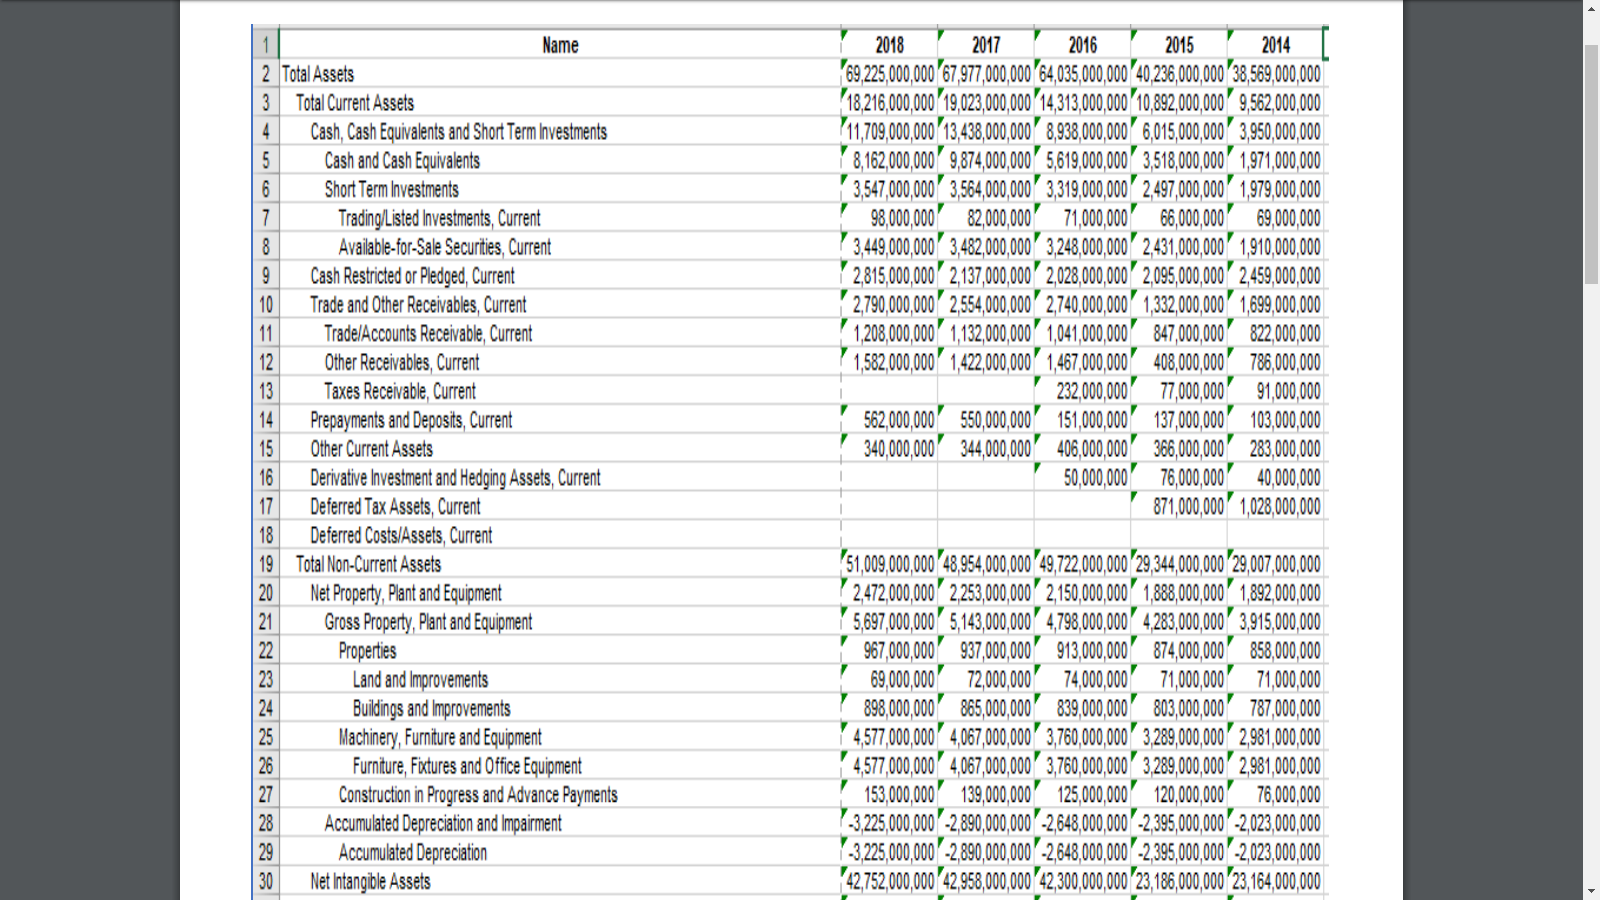
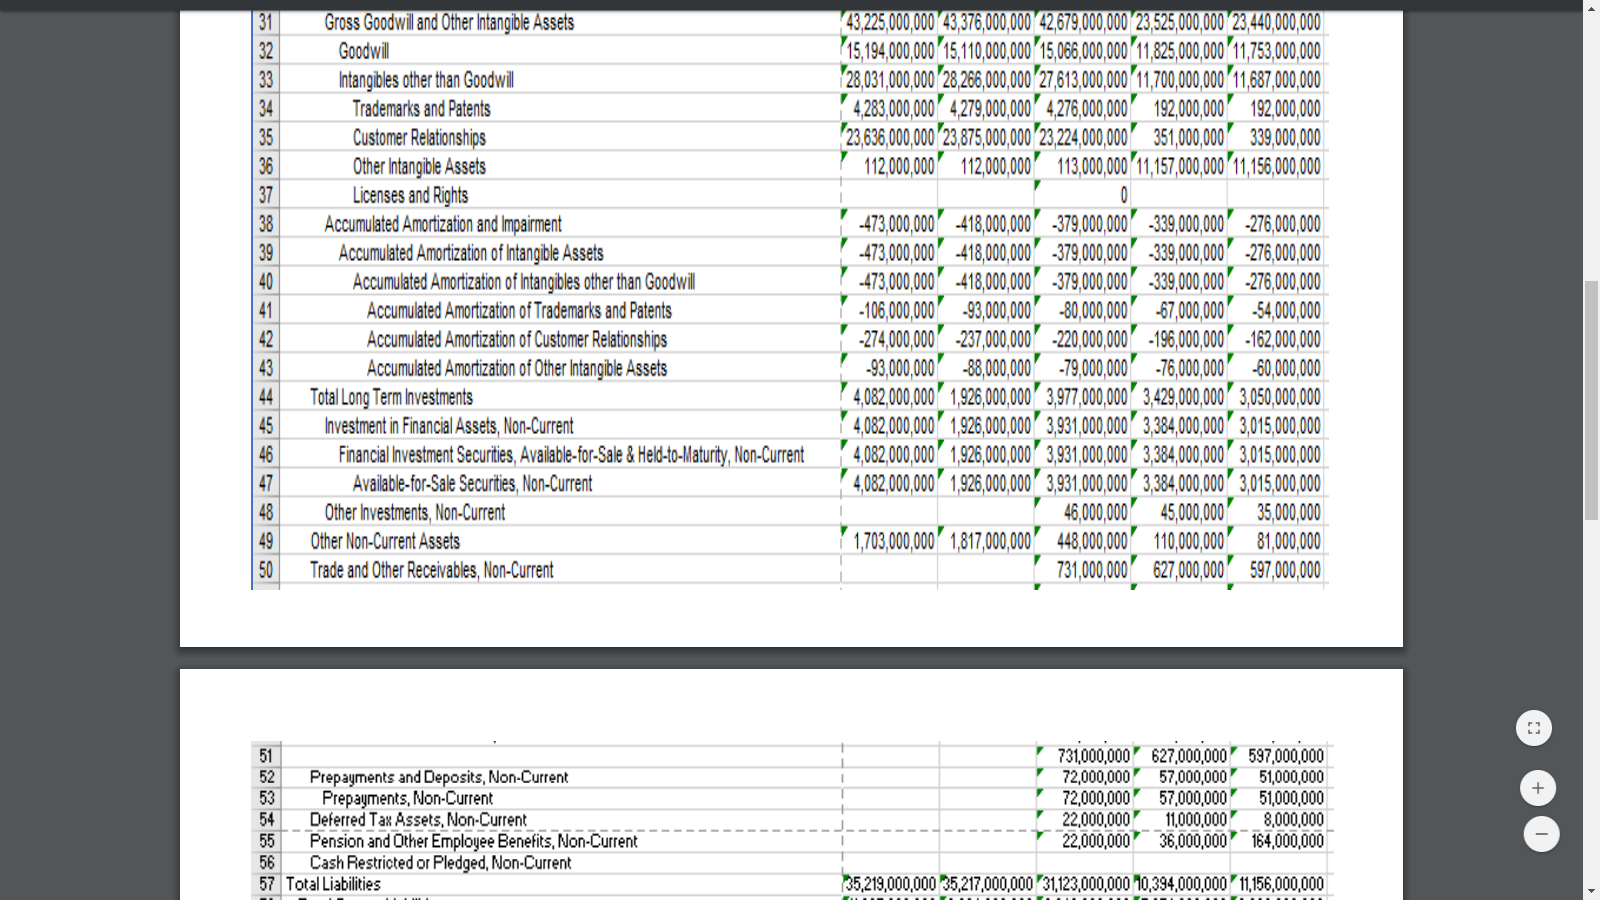
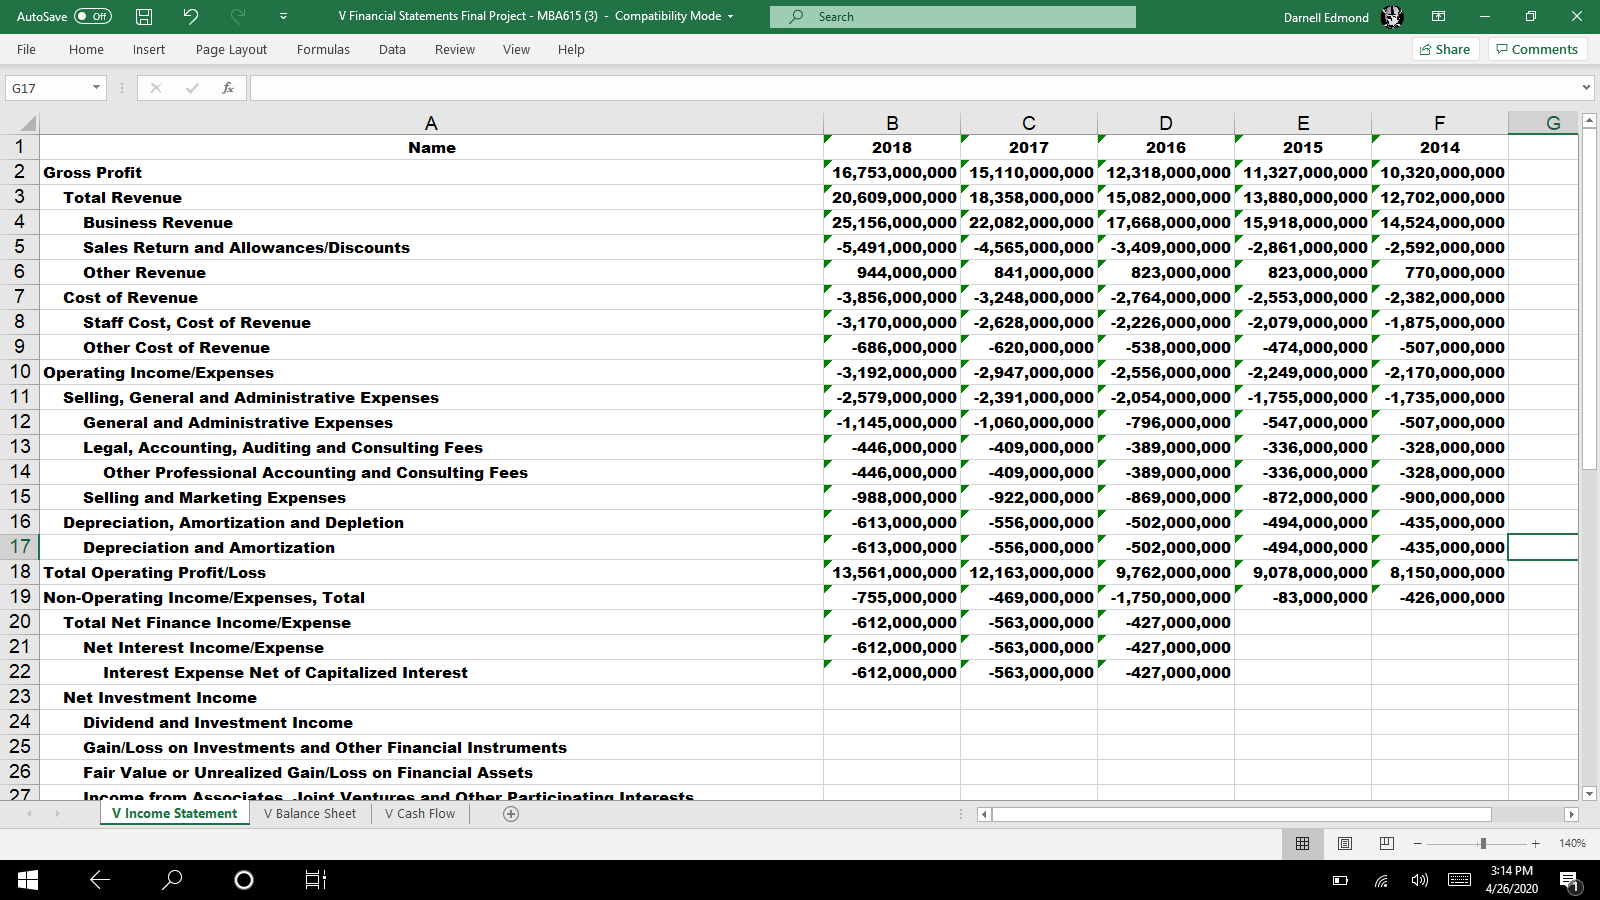
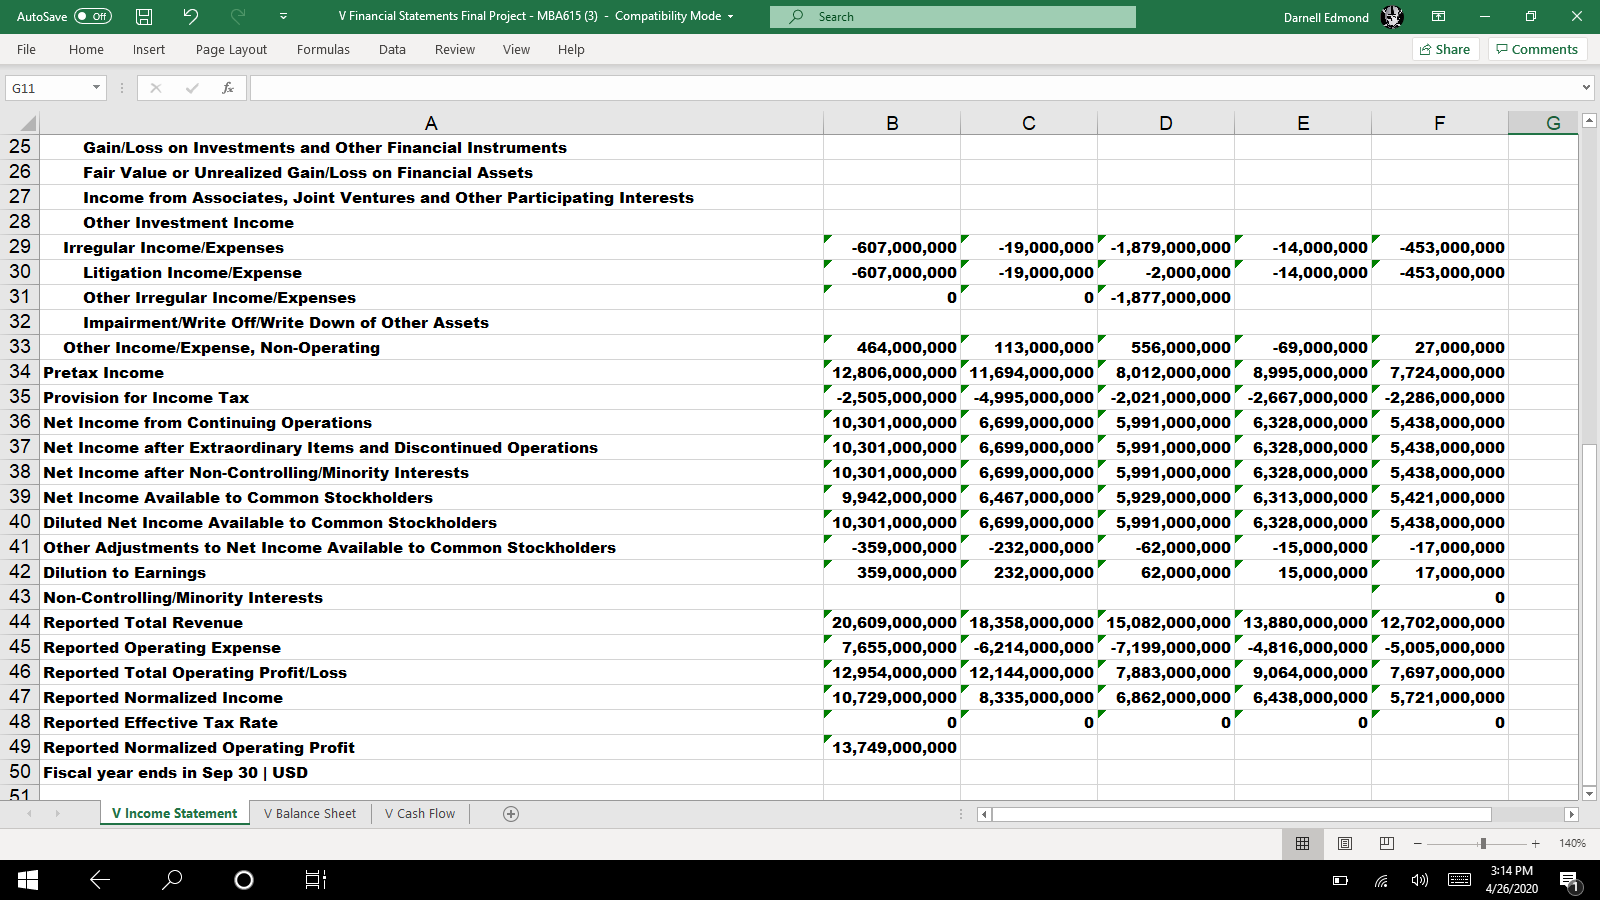
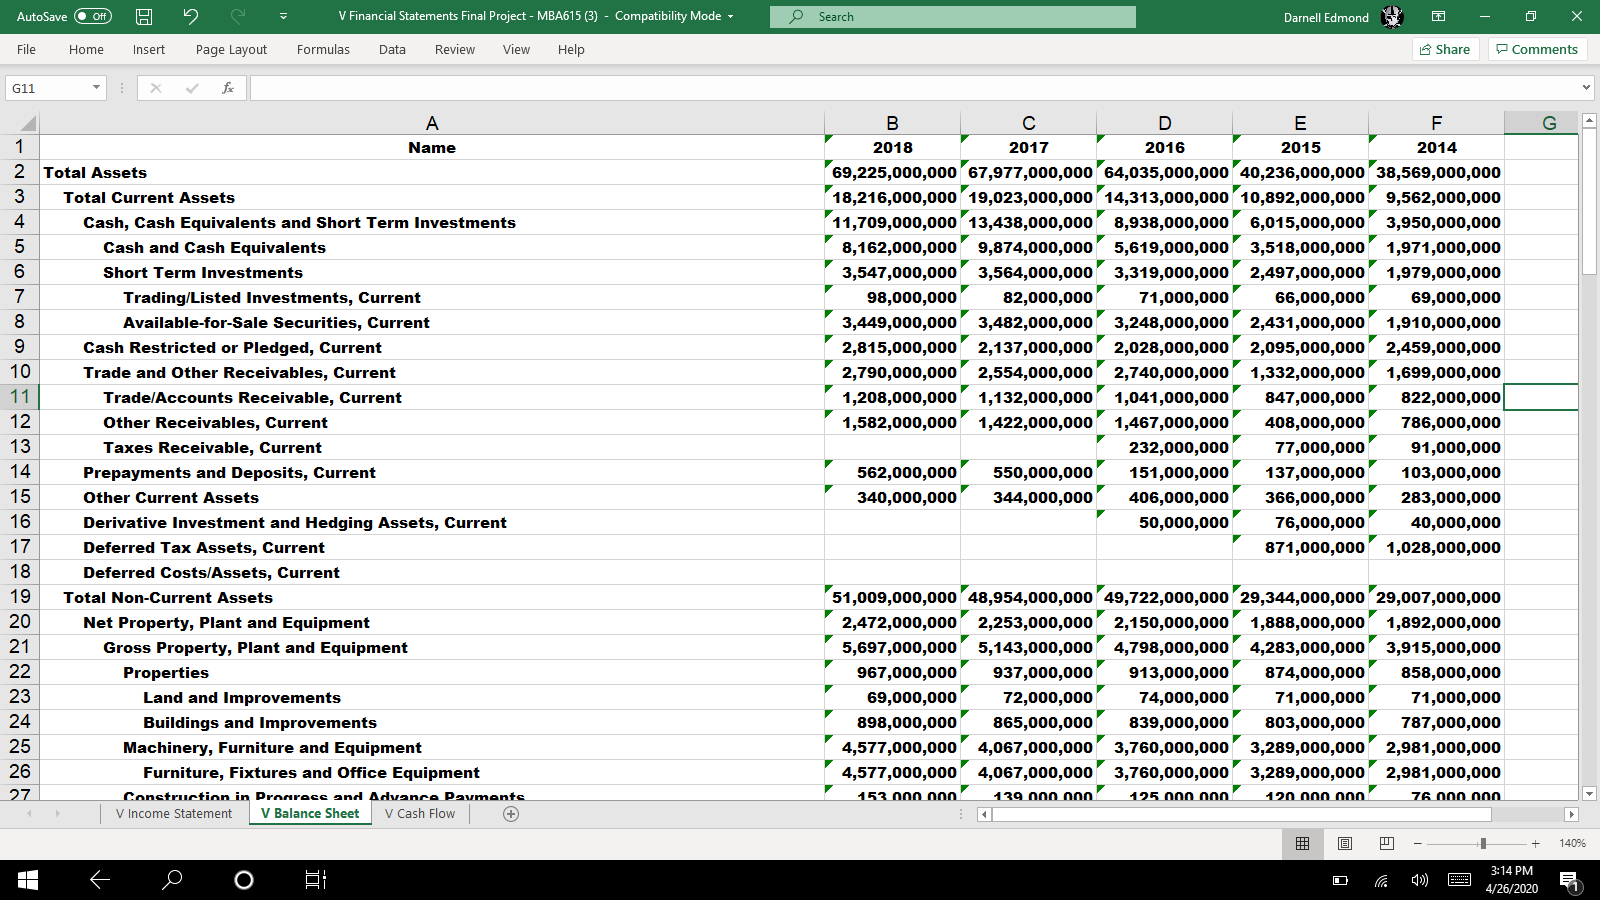
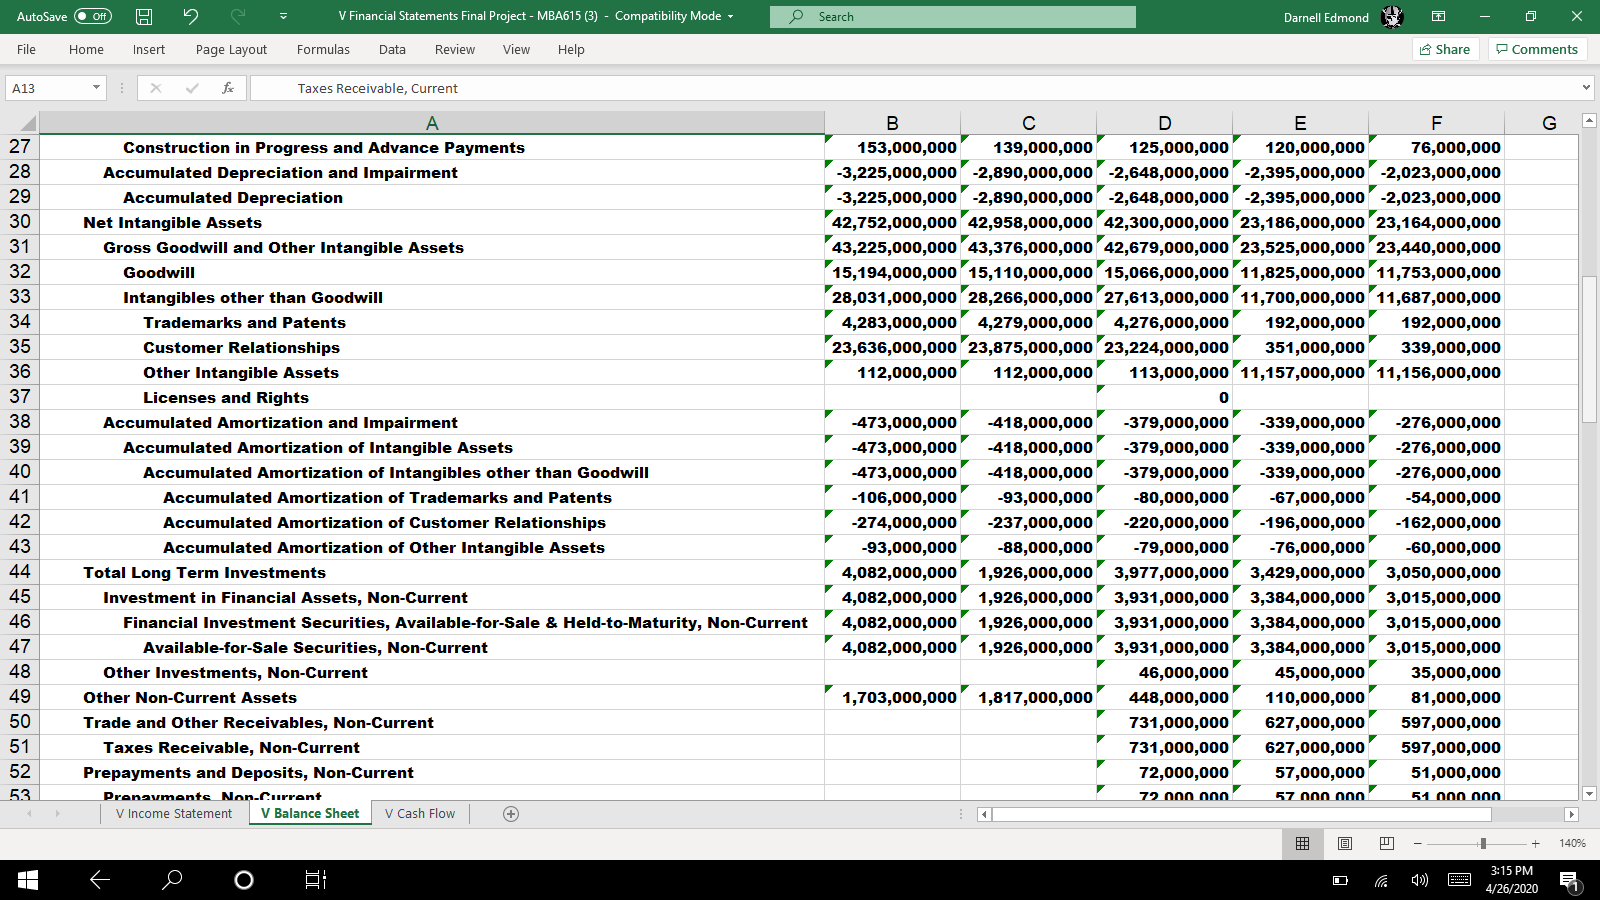
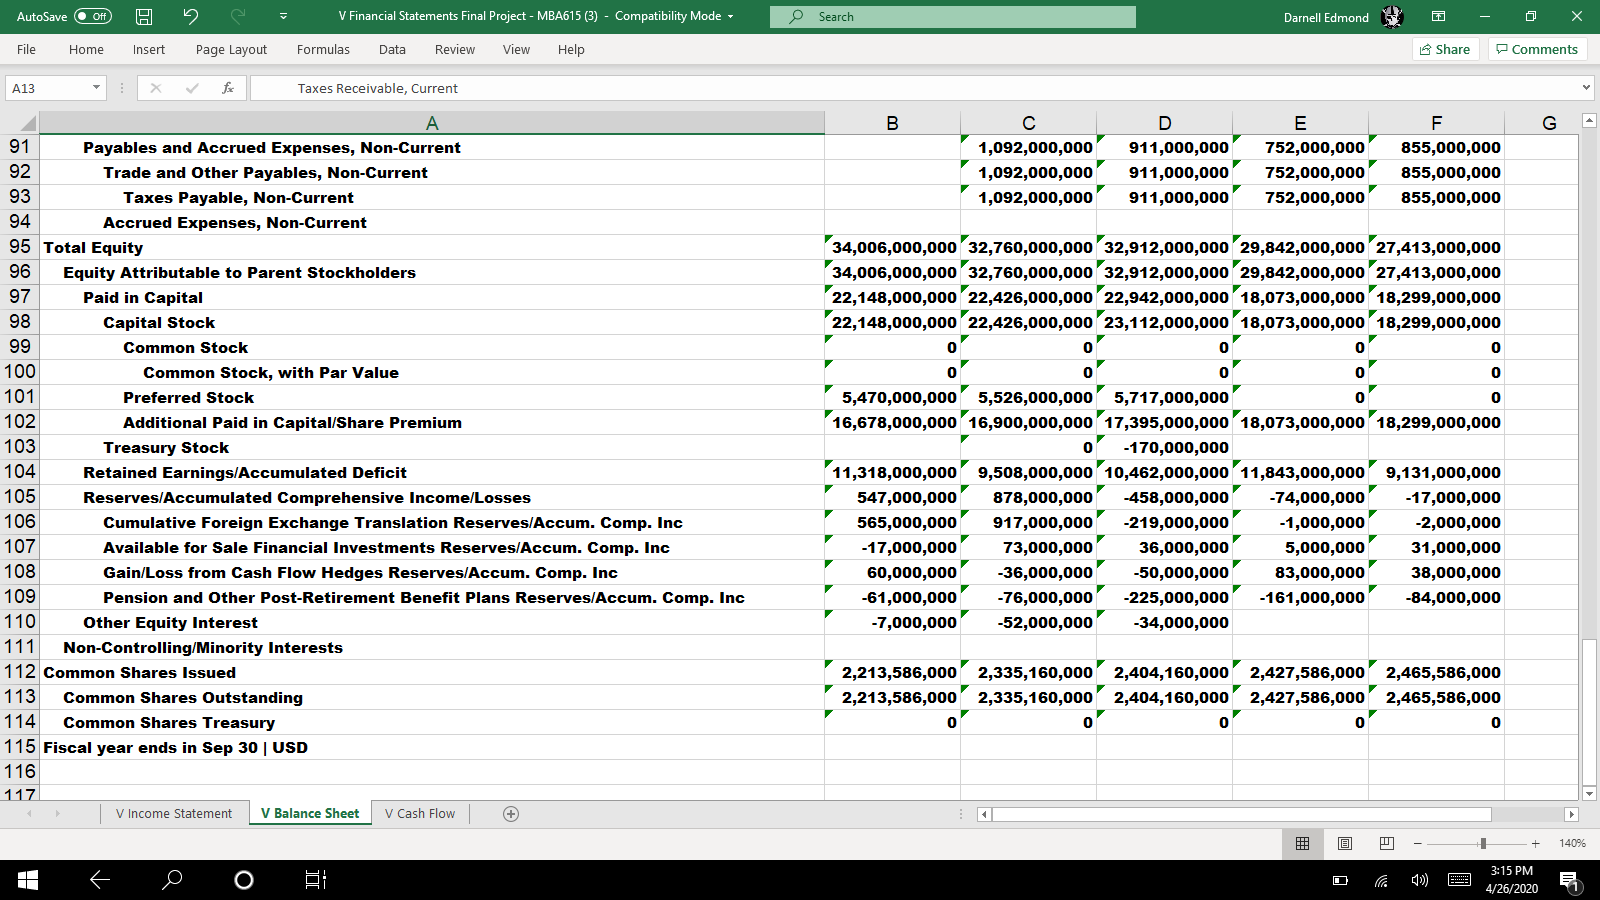
Name 2 Total Assets Total Current Assets Cash, Cash Equivalents and Short Term Investments Cash and Cash Equivalents Short Term Investments Trading Listed Investments, Current Available-for-Sale Securities, Current Cash Restricted or Pledged, Current Trade and Other Receivables, Current Trade/Accounts Receivable, Current Other Receivables, Current Taxes Receivable, Current Prepayments and Deposits Current Other Current Assets Derivative Investment and Hedging Assets, Current 17 Deferred Tax Assets, Current 18 Deferred Costs/Assets, Current 19 Total Non-Current Assets 20 Net Property, Plant and Equipment Gross Property, plant and Equipment Properties Land and Improvements Buildings and improvements Machinery, Furniture and Equipment Furniture, Fixtures and Office Equipment Construction in Progress and Advance Payments Accumulated Depreciation and Impairment Accumulated Depreciation Net Intangible Assets 7 2018 2017 2016 2015 2014 | 69,225,000,000 67,977,000,000 64,035,000,000 40,236,000,000 38,569,000,000 18,216,000,000 19,023,000,000 14,313,000,000'10,892,000,000 9,562,000,000 (11,709,000,000 13,438,000,000 8,938,000,000 6,015,000,000 3,950,000,000 8,162,000,000' 9,874,000,000' 5,619,000,000 3,518,000,000 1,971,000,000 3,547,000,000 3,564,000,000 3,319,000,000 2,497,000,000 1,979,000,000 98,000,000 82,000,000 71,000,000 66,000,000 69,000,000 73.449,000,000 3,482,000,000 3,248,000,000 2,431,000,000 1.910.000.000 2,815,000,000 2,137,000,000 2,028,000,000 2,095,000,000 2,459,000,000 2,790,000,000 2,554,000,000 2,740,000.000 1.332.000.000 1.699.000.000 1,208,000,000 1,132,000,000 1,041,000,000 847,000,000 822,000,000 1,582,000,000 1,422,000,000 1,467,000,000 408.000.000 786,000,000 232,000,000' 77,000,000 91,000,000 562,000,000' 550,000,000' 151,000,000 137,000,000 103,000,000 340,000,000 344,000,000 406,000,000 366,000,000 283,000,000 50,000,000 76,000,000 40,000,000 871,000,000 1,028,000,000 (51,009,000,000 48,954,000,000 49,722,000,000 29,344,000,000 29,007,000,000 12,472,000,000 2,253,000,000 2,150,000.000 1.888.000.000 1.892.000.000 Y 5,697,000,000 5,143,000,000 4,798,000,000 4,283,000,000 3,915,000,000 967,000,000' 937,000,000' 913,000,000 874,000,000 858,000,000 69,000,000 72,000,000 74,000,000 71,000,000 71,000,000 898,000,000' 865,000,000' 839,000,000' 803,000,000 787,000,000 14,577,000,000 4,067,000,000 3,760,000,000 3,289,000,000 2,981,000,000 4.577,000,000 4,067,000,000 3,760,000,000 3,289,000,000 2.981,000,000 153,000,000' 139,000,000 125,000,000 120,000,000 76,000,000 1-3,225,000,000 -2,890,000,000 -2.648,000,000 -2,395,000,000 -2,023,000,000 7-3,225,000,000 -2,890,000,000 2,648,000,000 -2,395,000,000 2,023,000,000 142,752,000,000'42,958,000,000 " 42,300,000,000 23,185,000,000 23,164,000,000 Gross Goodwil and Other Intangible Assets Goodwill Intangibles other than Goodwill Trademarks and Patents Customer Relationships Other Intangible Assets Licenses and Rights Accumulated Amortization and Impairment Accumulated Amortization of Intangible Assets Accumulated Amortization of Intangibles other than Goodwill Accumulated Amortization of Trademarks and Patents Accumulated Amortization of Customer Relationships Accumulated Amortization of Other Intangible Assets Total Long Term Investments Investment in Financial Assets, Non-Current Financial Investment Securities, Available-for-Sale & Held-to-Maturity, Non-Current Available-for-Sale Securities, Non-Current Other Investments, Non-Current Other Non-Current Assets Trade and Other Receivables, Non-Current 43,225,000,000 43,376,000,000 42,679,000,000 23,525,000,000 23,440,000,000 115,194,000,000 15,110,000,000 15,066,000.000 11.825,000,000 11,753,000,000 128,031,000,000 28,266,000,000 27,613,000.000 11.700.000.000 11.687.000.000 4,283,000,000 4,279,000,000 4,276,000,000 192,000,000 192,000,000 23,636,000,000 23,875,000,000 23,224,000,000' 351,000,000' 339,000,000 112,000,000 112,000,000 113,000,000 11,157,000,000 11,156,000,000 0 -473,000,000 -418,000,000' 379,000,000 -339,000,000 276,000,000 -473,000,000 -418,000,000 -379,000,000 -339,000,000 -276,000,000 -473,000,000 -418,000,000' 379,000,000 -339,000,000 276,000,000 -106,000,000 -93,000,000 -80,000,000 -67,000,000 -54,000,000 274,000,000 -237,000,000 220,000,000 -196,000,000 162,000,000 -93,000,000' -88,000,000' -79,000,000 -76,000,000 -60,000,000 Y 4,082,000,000 1,926,000,000 3,977,000,000 3,429,000,000 3,050,000,000 4,082,000,000 1,926,000,000 3,931,000,000 3,384,000,000 3,015,000,000 4,082,000,000 1,926,000,000 3,931,000,000 3,384,000,000 3,015,000,000 4,082,000,000 1,926,000,000 3,931,000,000 3,384,000,000 3,015,000,000 46,000,000 45,000,000 35,000,000 1,703,000,000 1,817,000,000 448,000,000 110,000,000 81,000,000 731,000,000 627,000,000 597,000,000 49 50 Prepayments and Deposits, Non-Current Prepayments, Non-Current Deferred Tax Assets, Non-Current Pension and Other Employee Benefits, Non-Current Cash Restricted or Pledged, Non-Current 57 Total Liabilities 731,000,000 627,000,000 72,000,000' 57,000,000' 72,000,000' 57,000,000 22.000.000 11.000.000 22,000,000 36,000,000 597,000,000 51,000,000 51,000,000 8,000,000 164,000,000 135,219,000,000 35,217,000,000 31,123,000,000 10,394,000,000 11,156,000,000 AutoSave Off H 2 C 5 V Financial Statements Final Project - MBA615 (3) - Compatibility Mode - Search Darnell Edmond $ - O X File Home Insert Page Layout Formulas Data Review View Help Share Comments G A 8 617 : x for A Name 2 Gross Profit Total Revenue Business Revenue Sales Return and Allowances/Discounts Other Revenue Cost of Revenue Staff Cost, Cost of Revenue 9 Other Cost of Revenue 10 Operating Income/Expenses 11 Selling, General and Administrative Expenses 12 General and Administrative Expenses Legal, Accounting, Auditing and Consulting Fees 14 Other Professional Accounting and Consulting Fees 15 Selling and Marketing Expenses 16 Depreciation, Amortization and Depletion 17 Depreciation and Amortization 18 Total Operating Profit/Loss 19 Non-Operating Income/Expenses, Total Total Net Finance Income/Expense 21 Net Interest Income/Expense Interest Expense Net of Capitalized Interest 23 Net Investment Income 24 Dividend and Investment Income Gain/Loss on Investments and Other Financial Instruments 26 Fair Value or Unrealized Gain/Loss on Financial Assets 27| Income from Ascoriates Joint Ventures and Other Particinating Intereste V Income Statement V Balance Sheet V Cash Flow + B C D E F 2018 2017 2016 2015 2014 16,753,000,000 15,110,000,000 12,318,000,000 11,327,000,000 10,320,000,000 20,609,000,000 18,358,000,000 15,082,000,000 13,880,000,000 12,702,000,000 25,156,000,000 22,082,000,000 17,668,000,000 15,918,000,000 14,524,000,000 -5,491,000,000 -4,565,000,000 3,409,000,000 -2,861,000,000 -2,592,000,000 944,000,000 841,000,000 823,000,000 823,000,000 770,000,000 -3,856,000,000 -3,248,000,000 -2,764,000,000 -2,553,000,000 -2,382,000,000 -3,170,000,000 -2,628,000,000 -2,226,000,000 -2,079,000,000 -1,875,000,000 -686,000,000 -620,000,000 -538,000,000 -474,000,000 -507,000,000 3,192,000,000 2,947,000,000 2,556,000,000 2,249,000,000 -2,170,000,000 -2,579,000,000 -2,391,000,000 -2,054,000,000 -1,755,000,000 -1,735,000,000 -1,145,000,000 -1,060,000,000 -796,000,000 -547,000,000 -507,000,000 -446,000,000 -409,000,000 -389,000,000 -336,000,000 -328,000,000 -446,000,000 -409,000,000 -389,000,000 -336,000,000 -328,000,000 -988,000,000 -922,000,000 -869,000,000 -872,000,000 -900,000,000 -613,000,000 -556,000,000 -502,000,000 -494,000,000 -435,000,000 -613,000,000 -556,000,000 -502,000,000 -494,000,000 -435,000,000 13,561,000,000 12,163,000,000 9,762,000,000 9,078,000,000 8,150,000,000 -755,000,000 -469,000,000 -1,750,000,000 -83,000,000 -426,000,000 -612,000,000' -563,000,000 -427,000,000 -612,000,000' -563,000,000 -427,000,000 -612,000,000' -563,000,000 -427,000,000 20 22 25 J -__ +_ + 140% 3:14 PM O fra 4)) 9 1/26/2020 AutoSave Off H 2 C 5 V Financial Statements Final Project - MBA615 (3) - Compatibility Mode - Search Darnell Edmond $ - O X Comments File Home Insert Page Layout Formulas Data Review View Help Share 611 : x v fic F G 25 27 29 -607,000,000 -607,000,000 - 19,000,000 -1,879,000,000 -19,000,000 2,000,000 0 -1,877,000,000 -14,000,000 -14,000,000 -453,000,000 453,000,000 31 Gain/Loss on Investments and Other Financial Instruments 26 Fair Value or Unrealized Gain/Loss on Financial Assets Income from Associates, Joint Ventures and Other Participating Interests 28 Other Investment Income Irregular Income/Expenses 30 Litigation Income/Expense Other Irregular Income/Expenses 32 Impairment/Write Off/Write Down of Other Assets 33 Other Income/Expense, Non-Operating 34 Pretax Income 35 Provision for Income Tax 36 Net Income from Continuing Operations 37 Net Income after Extraordinary Items and Discontinued Operations 38 Net Income after Non-Controlling/Minority Interests 39 Net Income Available to Common Stockholders 40 Diluted Net Income Available to Common Stockholders 41 Other Adjustments to Net Income Available to Common Stockholders 42 Dilution to Earnings 43 Non-Controlling/Minority Interests 44 Reported Total Revenue 45 Reported Operating Expense 46 Reported Total Operating Profit/Loss 47 Reported Normalized Income 48 Reported Effective Tax Rate 49 Reported Normalized Operating Profit 50 Fiscal year ends in Sep 30 USD 51 V Income Statement V Balance Sheet v Cash Flow 464,000,000 113,000,000 556,000,000 -69,000,000 27,000,000 12,806,000,000 11,694,000,000 8,012,000,000 8,995,000,000 7,724,000,000 -2,505,000,000 -4,995,000,000 -2,021,000,000 -2,667,000,000 -2,286,000,000 10,301,000,000 6,699,000,000 5,991,000,000 6,328,000,000 5,438,000,000 10,301,000,000' 6,699,000,000' 5,991,000,000' 6,328,000,000 5,438,000,000 10,301,000,000 6,699,000,000 5,991,000,000 6,328,000,000 5,438,000,000 9,942,000,000' 6,467,000,000' 5,929,000,000' 6,313,000,000 5,421,000,000 10,301,000,000 6,699,000,000 5,991,000,000 6,328,000,000 5,438,000,000 -359,000,000 -232,000,000 -62,000,000 -15,000,000 -17,000,000 359.000.000 232.000.000 62,000,000 15,000,000 17,000,000 20,609,000,000 18,358,000,000 15,082,000,000 13,880,000,000 12,702,000,000 7,655,000,000 -6,214,000,000 -7,199,000,000 -4,816,000,000 -5,005,000,000 12,954,000,000 12,144,000,000 7,883,000,000 9,064,000,000 7,697,000,000 10,729,000,000 8,335,000,000 6,862,000,000 6,438,000,000 5,721,000,000 13,749,000,000 J -__ +_ + 140% 3:14 PM a 0 B O fra 4)) 9 1/26/2020 AutoSave Off H 2 C 5 V Financial Statements Final Project - MBA615 (3) - Compatibility Mode - Search Darnell Edmond $ - O X File Home Insert Page Layout Formulas Data Review View Help Share Comments G a 611 : x for . Name 2 Total Assets Total Current Assets Cash, Cash Equivalents and Short Term Investments Cash and Cash Equivalents Short Term Investments Trading/Listed Investments, Current Available-for-Sale Securities, Current Cash Restricted or Pledged, Current 10 Trade and Other Receivables, Current 11 Trade/Accounts Receivable, Current Other Receivables, Current 13 Taxes Receivable, Current 14 Prepayments and Deposits, Current Other Current Assets 16 Derivative Investment and Hedging Assets, Current 17 Deferred Tax Assets, Current Deferred Costs/Assets, Current 19 Total Non-Current Assets Net Property, Plant and Equipment Gross Property, Plant and Equipment Properties Land and Improvements Buildings and Improvements Machinery, Furniture and Equipment Furniture, Fixtures and Office Equipment Construction in Pronrecs and Advance Paymente V Income Statement V Balance Sheet V Cash Flow + I B C D E F 2018 2017 - 2016 2015 2014 69,225,000,000 67,977,000,000 64,035,000,000 40,236,000,000 38,569,000,000 18,216,000,000 19,023,000,000 14,313,000,000 10,892,000,000 9,562,000,000 11,709,000,000 13,438,000,000 8,938,000,000 6,015,000,000 3,950,000,000 8,162,000,000 9,874,000,000 5,619,000,000 3,518,000,000 1,971,000,000 3,547,000,000 3,564,000,000 3,319,000,000 2,497,000,000 1,979,000,000 98,000,000 82,000,000 71,000,000 66,000,000 69,000,000 3,449,000,000 3,482,000,000' 3,248,000,000 2,431,000,000 1,910,000,000 2,815,000,000 2,137,000,000 2,028,000,000 2,095,000,000 2,459,000,000 2,790,000,000 2,554,000,000 2,740,000,000 1,332,000,000 1,699,000,000 1,208,000,000 1,132,000,000 1,041,000,000 847,000,000 822,000,000 1,582,000,000 1,422,000,000 1,467,000,000 408,000,000 786,000,000 232,000,000 77,000,000 91,000,000 562,000,000 550,000,000 151,000,000 137,000,000 103,000,000 340,000,000 344,000,000 406,000,000 366,000,000 283,000,000 50,000,000 76,000,000 40,000,000 871,000,000 1,028,000,000 12 15 20 51,009,000,000 48,954,000,000 49,722,000,000 29,344,000,000 29,007,000,000 2,472,000,000 2,253,000,000 2,150,000,000 1,888,000,000 1,892,000,000 5,697,000,000' 5,143,000,000' 4,798,000,000' 4,283,000,000 3,915,000,000 967,000,000 937,000,000 913,000,000 874,000,000 858,000,000 69,000,000 72,000,000 74,000,000 71,000,000 71,000,000 898,000,000 865,000,000 839,000,000 803,000,000 787,000,000 4,577,000,000 4,067,000,000 3,760,000,000 3,289,000,000 2,981,000,000 4,577,000,000 4,067,000,000 3,760,000,000 3,289,000,000 2,981,000,000 153.000.000 139 000 000 125 000 000 120 000 000 76.000.000 @ J -- + 140% 3:14 PM O fra ) 9 1/26/2020 AutoSave Off H 2 C 5 V Financial Statements Final Project - MBA615 (3) - Compatibility Mode - Search Darnell Edmond $ - O X File Home Insert Page Layout Formulas Data Review View Help Share Comments A13 : X for Taxes Receivable, Current B C D E 153,000,000 139,000,000 125,000,000 120,000,000 76,000,000 -3,225,000,000 -2,890,000,000 -2,648,000,000 -2,395,000,000 -2,023,000,000 -3,225,000,000 -2,890,000,000 -2,648,000,000 -2,395,000,000 -2,023,000,000 42,752,000,000 42,958,000,000 42,300,000,000 23,186,000,000 23,164,000,000 43,225,000,000 43,376,000,000 42,679,000,000 23,525,000,000 23,440,000,000 15,194,000,000 15,110,000,000 15,066,000,000 11,825,000,000 11,753,000,000 28,031,000,000 28,266,000,000 27,613,000,000 11,700,000,000 11,687,000,000 4,283,000,000 4,279,000,000 4,276,000,000 192,000,000 192,000,000 23,636,000,000 23,875,000,000 23,224,000,000 351,000,000 339,000,000 112,000,000 112,000,000 113,000,000 11,157,000,000 11,156,000,000 A Construction in Progress and Advance Payments Accumulated Depreciation and Impairment Accumulated Depreciation Net Intangible Assets Gross Goodwill and Other Intangible Assets Goodwill Intangibles other than Goodwill Trademarks and Patents Customer Relationships Other Intangible Assets Licenses and Rights Accumulated Amortization and Impairment Accumulated Amortization of Intangible Assets Accumulated Amortization of Intangibles other than Goodwill Accumulated Amortization of Trademarks and Patents Accumulated Amortization of Customer Relationships Accumulated Amortization of Other Intangible Assets Total Long Term Investments Investment in Financial Assets, Non-Current Financial Investment Securities, Available-for-Sale & Held-to-Maturity, Non-Current Available-for-Sale Securities, Non-Current Other Investments, Non-Current Other Non-Current Assets Trade and Other Receivables, Non-Current Taxes Receivable, Non-Current Prepayments and Deposits, Non-Current Prenavments Non.Current V Income Statement V Balance Sheet v Cash Flow -473,000,000 -473,000,000 -473,000,000 -106,000,000 -274,000,000 -93,000,000 4,082,000,000 4,082,000,000 4,082,000,000 4,082,000,000 -418,000,000 -418,000,000 -418,000,000 -93,000,000 -237,000,000 -88,000,000 1,926,000,000 1,926,000,000 1,926,000,000 1,926,000,000 -379,000,000 -379,000,000 -379,000,000 -80,000,000 -220,000,000 -79,000,000 3,977,000,000 3,931,000,000 3,931,000,000 3,931,000,000 46,000,000 448,000,000 731,000,000' 731,000,000' -339,000,000 -339,000,000 -339,000,000 -67,000,000 -196,000,000 -76,000,000 3,429,000,000 3,384,000,000 3,384,000,000 3,384,000,000 45,000,000 110,000,000 627,000,000 627,000,000 57,000,000 57 000 000 -276,000,000 -276,000,000 -276,000,000 -54,000,000 -162,000,000 -60,000,000 3,050,000,000 3,015,000,000 3,015,000,000 3,015,000,000 35,000,000 81,000,000 597,000,000 597,000,000 51,000,000 51.000.000 47 48 49 1,703,000,000 1,817,000,000 50 51 52 _53 72 000 000' @ J -- + 140% 3:15 PM a 0 B O fra ) 9 4/26/2020 AutoSave Off H 2 C 5 V Financial Statements Final Project - MBA615 (3) - Compatibility Mode - Search Darnell Edmond $ - O X File Home Insert Page Layout Formulas Data Review View Help Share Comments A13 : * fix Taxes Receivable, Current D 72,000,000 22,000,000 22,000,000 E 57,000,000 11,000,000 36,000,000 51,000,000 8,000,000 164,000,000 56 58 59 60 53 Prepayments, Non-Current 54 Deferred Tax Assets, Non-Current 55 Pension and Other Employee Benefits, Non-Current Cash Restricted or Pledged, Non-Current 57 Total Liabilities Total Current Liabilities Payables and Accrued Expenses, Current Trade and Other Payables, Current Trade/Accounts Payable, Current Other Payable, Current Interest Payable, Current Taxes Payable, Current Accrued Expenses, Current 66 Provisions, Current 67 Provision for Employee Entitlements, Current 68 Deferred Liabilities, Current 69 Other Deferred Liabilities, Current 70 Deferred Income/Customer Advances/Billings in Excess of Cost, Current Other Current Liabilities Financial Liabilities, Current Current Debt and Capital Lease Obligation Current Portion of Long Term Debt and Capital Lease Current Portion of Long Term Debt Other Current Portion of LT Debt Derivative and Hedging Liabilities, Current 78 Total Non-Current Liabilities 79 Financial Liabilities. Non.Current V Income Statement V Balance Sheet V Cash Flow 35,219,000,000 35,217,000,000 31,123,000,000 10,394,000,000 11,156,000,000 11,305,000,000 9,994,000,000 8,046,000,000 5,374,000,000 6,006,000,000 4,945,000,000 3,990,000,000 3,913,000,000 2,263,000,000 3,218,000,000 2,351,000,000 2,574,000,000 2,585,000,000 982,000,000 1,552,000,000 183,000,000 179,000,000 203,000,000 127,000,000 147,000,000 2,168,000,000 2,003,000,000 2,084,000,000 780,000,000 1,332,000,000 149,000,000 145,000,000 243,000,000' 153,000,000 75,000,000 73,000,000 2,594,000,000 1,416,000,000 1,328,000,000 1,281,000,000 1,666,000,000 901,000,000 757,000,000 673,000,000 503,000,000 450,000,000 901,000,000 757,000,000 673,000,000 503,000,000 450,000,000 1,300,000,000 81,000,000 82,000,000 1,300,000,000 81,000,000 82,000,000 4,159,000,000 3,498,000,000 3,460,000,000 2,272,000,000 2,111,000,000 0 1,749,000,000 0 255,000,000 145,000,000 0' 1,749,000,000 1,749,000,000 1,749,000,000 1,749,000,000 0 255,000,000 255,000,000 145,000,000 23,914,000,000 25,223,000,000 23,077,000,000 5,020,000,000 5,150,000,000 16 630 000 000 16 618 000 000 15 882 000 000 71 74 76 77 E @ J -_ + 140% 3:15 PM O fra 4)) 9 1/26/2020 AutoSave Off H 2 C 5 V Financial Statements Final Project - MBA615 (3) - Compatibility Mode - Search Darnell Edmond $ - O X File Home Insert Page Layout Formulas Data Review View Help Share Comments A13 : X for Taxes Receivable, Current BC 16,630,000,000' 16,618,000,000 15,882,000,000 16,630,000,000 16,618,000,000 15,882,000,000 16,630,000,000 16,618,000,000 15,882,000,000 16,630,000,000' 16,618,000,000 15,882,000,000 4,618,000,000 5,980,000,000 4,808,000,000 4,618,000,000 5,980,000,000 4,808,000,000 2,666,000,000 167,000,000 114,000,000 0 1,304,000,000 1,225,000,000 0 1,304,000,000 1,225,000,000 62,000,000 137,000,000 62,000,000 137,000,000 4,123,000,000 4,123,000,000 68,000,000 4,145,000,000 4,145,000,000 58,000,000 86 77,000,000 77,000,000 92,000,000 92,000,000 Financial Liabilities, Non-Current Long Term Debt and Capital Lease Obligation Long Term Debt Notes Payables, Non-Current Tax Liabilities, Non-Current Deferred Tax Liabilities, Non-Current Other Non-Current Liabilities Deferred Liabilities, Non-Current 87 Other Deferred Liabilities, Non-Current 88 Provisions, Non-Current 89 Provision for Employee Entitlements, Non-Current 90 Pension and Other Post-Retirement Benefit Plans, Non-Current 91 Payables and Accrued Expenses, Non-Current 92 Trade and Other Payables, Non-Current 93 Taxes Payable, Non-Current 94 Accrued Expenses, Non-Current 95 Total Equity 96 Equity Attributable to Parent Stockholders 97 Paid in Capital 98 Capital Stock 99 Common Stock 100 Common Stock, with Par Value Preferred Stock 102 Additional Paid in Capital/Share Premium 103 Treasury Stock 104 Retained Earnings/Accumulated Deficit 105 Reservac/Accumulated Comnrehensive Incomall neces V Income Statement V Balance Sheet V Cash Flow + 1,092,000,000 1,092,000,000 1,092,000,000 911,000,000 911,000,000 911,000,000 752,000,000 752,000,000 752,000,000 855,000,000 855,000,000 855,000,000 34,006,000,000 32,760,000,000 32,912,000,000 29,842,000,000 27,413,000,000 34,006,000,000 32,760,000,000 32,912,000,000 29,842,000,000 27,413,000,000 22,148,000,000 22,426,000,000 22,942,000,000 18,073,000,000 18,299,000,000 22,148,000,000 22,426,000,000 23,112,000,000 18,073,000,000 18,299,000,000 0 0 0 0 0 101 5,470,000,000' 5,526,000,000 5,717,000,000 16,678,000,000 16,900,000,000 17,395,000,000 18,073,000,000 18,299,000,000 0 -170,000,000 11,318,000,000 9,508,000,000 10,462,000,000 11,843,000,000 9,131,000,000 547 000 000 878.000.000' 458 000 000 74.000.000 17.000.000 -- + + 140% 3:15 PM O fra ) 9 4/26/2020 AutoSave Off H 2 C 5 V Financial Statements Final Project - MBA615 (3) - Compatibility Mode - Search Darnell Edmond $ - O X File Home Insert Page Layout Formulas Data Review View Help Share Comments A13 : X for Taxes Receivable, Current 91 1,092,000,000 1,092,000,000 1,092,000,000 911,000,000 911,000,000 911,000,000 752,000,000 752,000,000 752,000,000 855,000,000 855,000,000 855,000,000 94 34,006,000,000 32,760,000,000 32,912,000,000 29,842,000,000 27,413,000,000 34,006,000,000 32,760,000,000 32,912,000,000 29,842,000,000 27,413,000,000 22,148,000,000 22,426,000,000 22,942,000,000 18,073,000,000 18,299,000,000 22,148,000,000 22,426,000,000 23,112,000,000 18,073,000,000 18,299,000,000 98 Payables and Accrued Expenses, Non-Current 92 Trade and Other Payables, Non-Current 93 Taxes Payable, Non-Current Accrued Expenses, Non-Current 95 Total Equity 96 Equity Attributable to Parent Stockholders 97 Paid in Capital Capital Stock 99 Common Stock 100 Common Stock, with Par Value 101 Preferred Stock 102 Additional Paid in Capital/Share Premium 103 Treasury Stock 104 Retained Earnings/Accumulated Deficit 105 Reserves/Accumulated Comprehensive Income/Losses 106 Cumulative Foreign Exchange Translation Reserves/Accum. Comp. Inc 107 Available for Sale Financial Investments Reserves/Accum. Comp. Inc Gain/Loss from Cash Flow Hedges Reserves/Accum. Comp. Inc 109 Pension and Other Post-Retirement Benefit Plans Reserves/Accum. Comp. Inc 110 Other Equity Interest 111 Non-Controlling/Minority Interests 112 Common Shares Issued 113 Common Shares Outstanding 114 Common Shares Treasury 115 Fiscal year ends in Sep 30 USD 116 117 V Income Statement V Balance Sheet Cash Flow | 5,470,000,000' 5,526,000,000 5,717,000,000 16,678,000,000 16,900,000,000 17,395,000,000 18,073,000,000 18,299,000,000 0 -170,000,000 11,318,000,000 9,508,000,000 10,462,000,000 11,843,000,000 9,131,000,000 547,000,000 878,000,000' 458,000,000 -74,000,000 -17,000,000 565,000,000' 917,000,000 -219,000,000 -1,000,000 -2,000,000 -17,000,000 73,000,000 36,000,000 5,000,000 31,000,000 60,000,000 -36,000,000 -50,000,000 83,000,000 38,000,000 -61,000,000 -76,000,000' -225,000,000 -161,000,000 -84,000,000 -7,000,000 -52,000,000 -34,000,000 108 2,213,586,000 2,213,586,000 2,335,160,000 2,335,160,000 2,404,160,000 2,404,160,000 2,427,586,000' 2,465,586,000 2,427,586,000 2,465,586,000 o J -__ +_ + 140% 3:15 PM 4/26/2020 AutoSave Off H 2 C 5 V Financial Statements Final Project - MBA615 (3) - Compatibility Mode - Search Darnell Edmond $ - O X Comments File Home Insert Page Layout Formulas Data Review View Help Share F2 X fic 7,205,000,000 1 2 3 - B C 2018 2017 12,713,000,000 9,208,000,000 12,713,000,000' 9,208,000,000 12,713,000,0009,208,000,000 10,301,000,000' 6,699,000,000 5,069,000,000 7,089,000,000 613,000,000 556,000,000 613,000,000 556,000,000 327,000,000 235,000,000 -1,277,000,000 1,700,000,000 0 192,000,000 0 192,000,000 D E 2016 2015 5,574,000,000 6,584,000. 0 5,574,000,000 6,584,000,000 5,574,000,000 6,584,000,000 5,991,000,000 6,328,000,000 3,109,000,000 3,801,000,000 502,000,000 494,000,000 502,000,000 494,000,000 221,000,000 187,000,000 -764,000,000 195,000,000 F 2014 7,205,000,000 7,205,000,000 7,205,000,000 5,438,000,000 3,019,000,000 435,000,000 435,000,000 172,000,000 -580,000,000 10 11 12 13 14 15 16 Name Cash Flow from Operating Activities, Indirect Net Cash Flow from Continuing Operating Activities, Indirect Cash Generated from Operating Activities Income/Loss before Non-Cash Adjustment Total Adjustments for Non-Cash Items Depreciation, Amortization and Depletion, Non-Cash Adjustment Depreciation and Amortization, Non-Cash Adjustment Stock-Based Compensation, Non-Cash Adjustment Taxes, Non-Cash Adjustment Irregular Income/Loss, Non-Cash Adjustment Other Irregular Income/Loss, Non-Cash Adjustment Gain/Loss on Disposals, Non-Cash Adjustment Impairment/Write Off/Write Down of Capital Assets Loss/Reversal, Non-Cash Adjustment Other Operating Gain/Loss, Non-Cash Adjustment Other Non-Cash Items Excess Tax Benefit from Stock-Based Compensation, Non-Cash Adjustment Net Investment Income/Loss, Non-Cash Adjustment Unrealized Gain/Loss on Financial Instruments, Non-Cash Adjustment Gain/Loss on Financial Instruments, Non-Cash Adjustment Share of Profit/Loss from Associates, Joint Ventures and other Equity Investments, Non-Cash Adjustment Other Provisions, Non-Cash Adjustment Amortization of Securities, Non-Cash Adjustment Interest and Finance Income/Expenses, Non-Cash Adjustment Changes in Operating Capital Change in Trade and Other Receivables Change in Trade/Accounts Receivable Change in Other Receivables Change in Tax Receivables V Income Statement V Balance Sheet V Cash Flow 5,491,000,000 4,565,000,000 -85,000,000 -159,000,000 3,409,000,000 2,861,000,000 55,000,000 24,000,000 -63,000,000' -84,000,000 -255,000,000 110,000,000 -255,000,000 110,000,000 2,592,000,000 37,000,000 -90,000,000 17 0 0 20 4,000,000 14,000,000 453,000,000 23 24 25 26 27 28 2,657,000,000 4,580,000,000 -293,000,000 40,000,000 -70,000,000 -54,000,000 -223,000,000 94,000,000 3,526,000,000 3,545,000,000 326,000,000 359,000,000 -65,000,000 -19,000,000 391,000,000 378,000,000 -1,252,000,000 11,000,000 -53,000,000 13,000,000 51,000,000 29 - __ + 125% 3:19 PM 4/26/2020 AutoSave Off H 2 C 5 V Financial Statements Final Project - MBA615 (3) - Compatibility Mode - Search Darnell Edmond $ - O X Comments File Home Insert Page Layout Formulas Data Review View Help Share F2 X f 7,205,000,000 4,842,000,000 4,880,000,000 2,478,000,000 260,000,000 265,000,000' -206,000,000 3,000,000 -30,000,000 262,000,000 -176,000,000 2,213,000,000 466,000,000 D E -3,823,000,000 3,011,000,000 -29,000,000 -893,000,000 -259,000,000 -565,000,000 43,000,000 -13,000,000 302,000,000 -552,000,000 230,000,000 328,000,000 F 2,825,000,000 1,562,000,000 51,000,000 -56,000,000 107,000,000 1,511,000,000 33 -941,000,000 -941,000,000 -3,084,000,000 735,000,000 -10,916,000,000 1,435,000,000 3,084,000,000 735,000,000 -10,916,000,000 1,435,000,000 -718,000,000'-707,000,000 -523,000,000 414,000,000 14,000,000 12,000,000 0 10,000,000 14,000,000 12,000,000 0 10,000,000 40 43 30 Change in Other Current Assets 31 Change in Payables and Accrued Expenses 32 Change in Trade and Other Payables Change in Trade/Accounts Payable 34 Change in Other Payables 35 Change in Accrued Expenses 36 Change in Other Operating Capital 37 Cash Flow from Investing Activities 38 Cash Flow from Continuing Investing Activities 39 Capital Expenditure, Reported Purchase/Sale and Disposal of Property, Plant and Equipment, Net 41 Sale and Disposal of Property, Plant and Equipment 42 Purchase of Property, Plant and Equipment Purchase/Sale of Business, Net 44 Purchase Acquisition of Business 45 Purchase/Sale of Investments, Net 46 Purchase of Investments 47 Sale of Investments Other Investing Cash Flow 49 Dividends Received/Paid, CFI 50 Cash Flow from Financing Activities 51 Cash Flow from Continuing Financing Activities Issuance of/Payments for Common Stock, Net Payments for Common Stock 54 Issuance of/Repayments for Debt, Net 55 Issuance of/Repayments for Long Term Debt, Net 56 Proceeds from Issuance of Long Term Debt 57 Repayments for Long Term Debt Issue and Financing Costs V Income Statement V Balance Sheet v Cash Flow -196,000,000' -302,000,000 -9,082,000,000 -93,000,000 -196,000,000' 302,000,000 -9,082,000,000 -93,000,000 -2,184,000,000 1,732,000,000 -1,311,000,000 -938,000,000 -5,822,000,000 3,284,000,000 -28,014,000,000 2,875,000,000 3,638,000,000 5,016,000,000 26,703,000,000 1,937,000,000 - 149,000,000 -149,000,000 -239,000,000 -2,581,000,000 2,342,000,000 48 -6,478,000,000 -6,478,000,000 4,118,000,000 4,118,000,000 52 -11,240,000,000 -5,924,000,000 7,477,000,000 3,603,000,000 -11,240,000,000 -5,924,000,000 7,477,000,000 3,603,000,000 -7,192,000,000 -6,891,000,000 -7,157,000,000 2,910,000,000 -7,192,000,000 -6,891,000,000 -7,157,000,000 2,910,000,000 -1,750,000,000 2,488,000,000 15,971,000,000 | -1,750,000,000 2,488,000,000 15,971,000,000 0 2,488,000,000 15,971,000,000 -1,750,000,000 0 -15,000,000 -98,000,000 58 0 __ + 125% 0 -- ra 4) 9 3:20 PM O 1/26/2020 AutoSave Off H 2 C 5 V Financial Statements Final Project - MBA615 (3) - Compatibility Mode - Search Darnell Edmond $ - O X Comments File Home Insert Page Layout Formulas Data Review View Help Share F2 _ A D E 3,638,000,000 5,016,000,000 26,703,000,000 1,937,000,000 F 2,342,000,000 49 51 -6,478,000,000 -6,478,000,000 4,118,000,000 4,118,000,000 53 55 X fic 7,205,000,000 A 47 Sale of Investments 48 Other Investing Cash Flow Dividends Received/Paid, CFI 50 Cash Flow from Financing Activities Cash Flow from Continuing Financing Activities 52 Issuance of/Payments for Common Stock, Net Payments for Common Stock 54 Issuance of/Repayments for Debt, Net Issuance of/Repayments for Long Term Debt, Net 56 Proceeds from Issuance of Long Term Debt Repayments for Long Term Debt 58 Issue and Financing Costs 59 Debt Issuance Costs Cash Dividends and Interest Paid Cash Dividends Paid Preferred Stock Dividends Paid Common Stock Dividends Paid Proceeds from Issuance/Exercising of Stock Options/Warrants 65 Other Financing Cash Flow 66 Excess Tax Benefit from Share-Based Compensation, Financing Activities 67 Issuance of/Repayments for Lease Financing 68 Repayments for Lease Financing 69 Cash and Cash Equivalents, End of Period 70 Change in Cash 71 Effect of Exchange Rate Changes 72 Cash and Cash Equivalents, Beginning of Period 73 Change in Cash As Reported, Supplemental 74 Income Tax Paid, Supplemental 75 Interest Paid, Supplemental V Income Statement V Balance Sheet v Cash Flow -11,240,000,000 -5,924,000,000 7,477,000,000 3,603,000,000 -11,240,000,000 -5,924,000,000 7,477,000,000 3,603,000,000 | -7,192,000,000 -6,891,000,000 7,157,000,000 2,910,000,000 -7,192,000,000 -6,891,000,000 -7,157,000,000 2,910,000,000 (-1,750,000,000 2,488,000,000 15,971,000,000 -1,750,000,000 2,488,000,000 15,971,000,000 0 2,488,000,000 15,971,000,000 -1,750,000,000 0 - 15,000,000 -98,000,000 -15,000,000 -98,000,000 -1,918,000,000 -1,579,000,000 -1,350,000,000 1,177,000,000 -1,918,000,000 -1,579,000,000 -1,350,000,000 1,177,000,000 -1,579,000,000 1,177,000,000 164,000,000 149,000,000 95,000,000 82,000,000 -544,000,000 -76,000,000 47,000,000 318,000,000 63,000,000 84,000,000 0 -1,006,000,000 -1,006,000,000 63 64 -1,006,000,000 91,000,000 -1,535,000,000 90,000,000 8,162,000,000 9,874,000,000 -1,611,000,000 4,019,000,000 -101,000,000' 236,000,000 9,874,000,000 5,619,000,000 -1,712,000,000 4,255,000,000 -2,285,000,000 3,038,000,000 -545,000,000' 489,000,000 5,619,000,000 3,518,000,000 2,135,000,000 1,546,000,000 - 34,000,000 1,000,000 3,518,000,000 1,971,000,000 2,101,000,000 1,547,000,000 -2,842,000,000 2,486,000,000 -244,000,000 1,971,000,000 -214,000,000 -1,000,000 2,186,000,000 -215,000,000 -2,656,000,000 - ___ + 125% 3:20 PM O fra ) 1/26/2020 AutoSave Off H 2 S - MA Financial Statements Final Project - MBA615 (2) - Compatibility Mode - Search Darnell Edmond $ - O X Comments File Home Insert Page Layout Formulas Data Review View Help Share G H IA 3 4 N35 x V for Name 2 Total Revenue Business Revenue Sales Return and Allowances/Discounts Other Revenue 6 Operating Income/Expenses 7 Selling, General and Administrative Expenses Staff Costs General and Administrative Expenses 10 Legal, Accounting, Auditing and Consulting Fees Telecommunication Expense 12 Selling and Marketing Expenses 13 Depreciation, Amortization and Depletion Depreciation and Amortization 15 Provision Expense/Write-Back 16 Provision for Doubtful Accounts 17 Total Operating Profit/Loss 18 Non-Operating Income/Expenses, Total 19 Total Net Finance Income/Expense 20 Net Interest Income/Expense 21 Interest Expense Net of Capitalized Interest Interest Income Net Investment Income Gain/Loss on Foreign Exchange 25 Other Investment Income 26 Gain/Loss on Investments and Other Financial Instruments 27 Irregular Inrama/Fynences MA Income Statement MA Balance Sheet MA Cash Flow + B C D E F 2018 2017 2016 2015 2014 14,950,000,000 12,497,000,000 10,776,000,000 9,667,000,000 9,473,000,000 18,483,000,000 15,492,000,000 10,776,000,000 9,667,000,000 11,056,000,000 -6,881,000,000 -5,848,000,000 -3,271,000,000 3,348,000,000 2,853,000,000 1,688,000,000 -6,576,000,000 -5,754,000,000 4,864,000,000 4,610,000,000 -4,397,000,000 -6,117,000,000 -5,318,000,000 4,491,000,000 -4,244,000,000 4,076,000,000 -3,214,000,000 -2,687,000,000 -2,225,000,000 -2,105,000,000 -2,064,000,000 -1,019,000,000 -874,000,000 -698,000,000 -646,000,000 -570,000,000 -377,000,000 -355,000,000 -337,000,000 -310,000,000 -307,000,000 -600,000,000 -504,000,000 -420,000,000 -362,000,000 -273,000,000 -907,000,000 -898,000,000 -811,000,000 -821,000,000 -862,000,000 -459,000,000 436,000,000 -373,000,000 -366,000,000 -321,000,000 -459,000,000 -436,000,000 -373,000,000 -366,000,000 -321,000,000 11 14 8,374,000,000' 6,743,000,000 5,912,000,000 -1,170,000,000 -221,000,000 -266,000,000 -186,000,000 -154,000,000 -95,000,000 -186,000,000 -154,000,000 -95,000,000 -186,000,000 -154,000,000 -95,000,000 22 5,057,000,000 5,076,000,000 -99,000,000 3,000,000 -61,000,000 -22,000,000 -61,000,000 -22,000,000 -61,000,000 -48,000,000 26,000,000 107,000,000 32,000,000 82,000,000 30,000,000 25,000,000 2,000,000 -61 000 000 24 158,000,000 36,000,000 122,000,000 -50,000,000 -106,000,000 56,000,000 9,000,000 -34,000,000 43,000,000 1128 000 000 15.000.000 117 000 000 J -__ 140% +_ + 3:25 PM 4/26/2020 o la 1) 2 AutoSave Off H 2 S - MA Financial Statements Final Project - MBA615 (2) - Compatibility Mode - Search Darnell Edmond $ - O X Comments File Home Insert Page Layout Formulas Data Review View Help Share N35 : * fax G H 10 23 25 21 Interest Expense Net of Capitalized Interest Interest Income Net Investment Income 24 Gain/Loss on Foreign Exchange Other Investment Income Gain/Loss on Investments and Other Financial Instruments 27 Irregular Income/Expenses 28 Litigation Income/Expense 29 Other Income/Expense, Non-Operating 30 Pretax Income 31 Provision for Income Tax 32 Net Income from Continuing Operations 33 Net Income after Extraordinary Items and Discontinued Operations 34 Net Income after Non-Controlling/Minority Interests 35 Net Income Available to Common Stockholders 36 Diluted Net Income Available to Common Stockholders 37 Non-Controlling/Minority Interests 38 Reported Total Revenue 39 Reported Operating Expense 40 Reported Total Operating Profit/Loss 41 Reported Normalized Income 42 Reported Effective Tax Rate Reported Normalized Operating Profit 44 Gross Profit 45 Cost of Revenue 46 Fiscal year ends in Dec 31 USD 47| MA Income Statement MA Balance Sheet MA Cash Flow + B C D E F -186,000,000 -154,000,000 -95,000,000 -61,000,000 -48,000,000 26,000,000 158,000,000 -50,000,000 9,000,000 107,000,000 32,000,000 36,000,000 -106,000,000 -34,000,000 82,000,000 30,000,000 122,000,000 56,000,000 43,000,000 25,000,000 2,000,000 -1,128,000,000 -15,000,000 -117,000,000 -61,000,000 -1,128,000,000 -15,000,000 - 117,000,000 -61,000,000 -14,000,000 -2,000,000 -63,000,000 -84,000,000 -7,000,000 7,204,000,000 6,522,000,000 5,646,000,000 4,958,000,000 5,079,000,000 -1,345,000,000 -2,607,000,000 -1,587,000,000 -1,150,000,000 -1,462,000,000 5,859,000,000 3,915,000,000 4,059,000,000 3,808,000,000 3,617,000,000 5,859,000,000 3,915,000,000 4,059,000,000 3,808,000,000 3,617,000,000 5,859,000,000 3,915,000,000 4,059,000,000 3,808,000,000 3,617,000,000 5,859,000,000 3,915,000,000 4,059,000,000 3,808,000,000 3,617,000,000 5,859,000,000 3,915,000,000 4,059,000,000 3,808,000,000 3,617,000,000 14,950,000,000 12,497,000,000 10,776,000,000 9,667,000,000 9,473,000,000 -7,668,000,000 -5,875,000,000 -5,015,000,000 -4,589,000,000 -4,367,000,000 7,282,000,000 6,622,000,000 5,761,000,000 5,078,000,000 5,106,000,000 6,792,000,000 4,906,000,000 4,144,000,000 3,903,000,000 5,878,000,000 5,218,000,000 - + 140% 3:25 PM 4/26/2020 AutoSave Off H 2 S - MA Financial Statements Final Project - MBA615 (2) - Compatibility Mode - Search Darnell Edmond $ - O X Comments File Home Insert Page Layout Formulas Data Review View Help Share G B B C D E F 2018 2017 2016 2015 2014 24,860,000,000 21,329,000,000 18,675,000,000 16,269,000,000 15,329,000,000 16,171,000,000 13,797,000,000 13,228,000,000 10,985,000,000 10,997,000,000 8,378,000,000 7,782,000,000 8,335,000,000 6,738,000,000 6,305,000,000 6,682,000,000 5,933,000,000 6,721,000,000 5,747,000,000 5,137,000,000 1,696,000,000 1,849,000,000 1,614,000,000 991,000,000 1,168,000,000 1,696,000,000 1,849,000,000 1,614,000,000 991,000,000 1,168,000,000 10 1,633,000,000 4,728,000,000 4,728,000,000 1,631,000,000 3,344,000,000 3,344,000,000 1,534,000,000 2,509,000,000 2,509,000,000 1,436,000,000 1,490,000,000 2,147,000,000 2,161,000,000 2,147,000,000 2,161,000,000 610 x for . Name 2 Total Assets Total Current Assets Cash, Cash Equivalents and Short Term Investments Cash and Cash Equivalents Short Term Investments Available-for-Sale Securities, Current Held-to-Maturity Securities, Current Cash Restricted or Pledged, Current Trade and Other Receivables, Current 11 Trade/Accounts Receivable, Current 12 Taxes Receivable, Current 13 Other Receivables, Current Prepayments and Deposits, Current 15 Other Current Assets 16 Deferred Tax Assets, Current 17 Deferred Costs/Assets, Current 18 Total Non-Current Assets 19 Net Property, Plant and Equipment Gross Property, Plant and Equipment Properties Buildings and Improvements Leasehold and Improvements Machinery, Furniture and Equipment Furniture, Fixtures and Office Equipment Other Equipment 27. Accumulated Donrariation and Imnairment 1 MA Income Statement MA Balance Sheet MA Cash Flow 14 850,000,000 664,000,000 829,000,000 603,000,000 541,000,000' 499,000,000 497,000,000 244,000,000 300,000,000 0 8,689,000,000 921,000,000 1,768,000,000 696,000,000 481,000,000 215,000,000 1,072,000,000 85,000,000 987,000,000 .847 000 000 7,532,000,000 829,000,000 1,543,000,000 621,000,000 455,000,000 166,000,000 922,000,000 81,000,000 841,000,000 714 000 000 5,447,000,000 733,000,000 1,336,000,000 667,000,000 534,000,000 133,000,000 669,000,000 63,000,000 606,000,000 603.000.000 5,284,000,000 675,000,000 1,166,000,000 615,000,000 503,000,000 112,000,000 551,000,000 54,000,000 497,000,000 .491.000.000 4,332,000,000 615,000,000 1,052,000,000 601,000,000 510,000,000 91,000,000 451,000,000 53,000,000 398,000,000 437 000 000 25 26 + @ -- + + 140% O fra ) 9 3:26 PM 4/26/2020 AutoSave Off H 2 S - MA Financial Statements Final Project - MBA615 (2) - Compatibility Mode - Search Darnell Edmond $ - O X Comments File Home Insert Page Layout Formulas Data Review View Help Share 610 : x v fic Accumulated Depreciation and Impairment Accumulated Depreciation Net Intangible Assets Gross Goodwill and Other Intangible Assets Goodwill Intangibles other than Goodwill Software and Technology Customer Relationships Other Intangible Assets Trademarks and Patents Accumulated Amortization and Impairment Accumulated Amortization of Intangible Assets Accumulated Amortization of Intangibles other than Goodwill Accumulated Amortization of Software and Technology Accumulated Amortization of Customer Relationships Accumulated Amortization of Other Intangible Assets Accumulated Amortization of Trademarks and Patents Total Long Term Investments Long Term Equity Investments Investment in Financial Assets, Non-Current Financial Investment Securities, Available-for-Sale & Held-to-Maturity, Non-Current Available-for-Sale Securities, Non-Current Held-to-Maturity Securities, Non-Current Trade and Other Receivables, Non-Current Taxes Receivable, Non-Current Prepayments and Deposits, Non-Current Pranayments Non.Current MA Income Statement MA Balance Sheet MA Cash Flow + BC DE -847,000,000 -714,000,000 -603,000,000 -491,000,000 -847,000,000 -714,000,000 -603,000,000 -491,000,000 3,895,000,000 4,155,000,000 2,478,000,000 2,694,000,000 5,070,000,000 5,312,000,000 3,452,000,000 3,510,000,000 2,904,000,000 3,035,000,000 1,756,000,000 1,891,000,000 2,166,000,000 2,277,000,000 1,696,000,000 1,619,000,000 1,514,000,000 1,572,000,000 1,210,000,000 1,086,000,000 606,000,000 648,000,000 437,000,000 478,000,000 46,000,000 27,000,000 23,000,000 25,000,000 30,000,000 26,000,000 30,000,000 -1,175,000,000 -1,157,000,000 -974,000,000 -816,000,000 -1,175,000,000 -1,157,000,000 -974,000,000 -816,000,000 -1,175,000,000 -1,157,000,000 -974,000,000 -816,000,000 -898,000,000 -888,000,000 -768,000,000 -625,000,000 -232,000,000 -214,000,000 -162,000,000 -149,000,000 -45,000,000 -26,000,000 -22,000,000 -19,000,000 -29,000,000 -22,000,000 -23,000,000 337,000,000 249,000,000 132,000,000 166,000,000 337,000,000 249,000,000 132,000,000 166,000,000 -437,000,000 -437,000,000 2,236,000,000 2,899,000,000 1,522,000,000 1,377,000,000 839,000,000 470,000,000 20,000,000 48,000,000 -663,000,000 -663,000,000 -663,000,000 496,000,000 -115,000,000 -14,000,000 -38,000,000 245,000,000 245,000,000 47 48 49 51 298,000,000 298,000,000 0 178,000,000 178,000,000 352,000,000 352 000 000 175,000,000 175,000,000 325,000,000 325 000 000 160,000,000 160,000,000 352,000,000 352 000 000 8 9,000,000 89,000,000 407,000,000 407 000 000 52 _53 2 - 140% + + 3:26 PM 4/26/2020 O fra ) 9 AutoSave Off H 2 S - MA Financial Statements Final Project - MBA615 (2) - Compatibility Mode - Search Darnell Edmond $ - O X Comments File Home Insert Page Layout Formulas Data Review View Help Share 610 x v for 54 B C 0 352,000,000 570,000,000 250,000,000 2,668,000,000' 1,519,000,000 325,000,000 307,000,000 1,297,000,000 352,000,000 317,000,000 920,000,000 407,000,000 96,000,000 644,000,000 56 59 19,442,000,000 15,832,000,000 11,593,000,000 8,793,000,000 9,064,000,000 6,916,000,000 2,884,000,000 2,470,000,000 2,726,000,000 2,276,000,000 158,000,000 194,000,000 12,991,000,000 10,207,000,000 7,206,000,000 6,269,000,000 5,595,000,000 4,810,000,000 1,716,000,000 1,481,000,000 1,555,000,000' 1,338,000,000 161,000,000 143,000,000 8,505,000,000 6,222,000,000 4,771,000,000 1,666,000,000 1,561,000,000 105,000,000 60 4,446,000,000 3,879,000,000 3,329,000,000 3,105,000,000 53 Prepayments, Non-Current Deferred Tax Assets, Non-Current 55 Other Non-Current Assets Deferred Costs/Assets, Non-Current 57 Total Liabilities 58 Total Current Liabilities Payables and Accrued Expenses, Current Trade and Other Payables, Current Trade/Accounts Payable, Current Taxes Payable, Current Amount Due to Related Parties/Shareholders, Current Accrued Expenses, Current Financial Liabilities, Current Current Debt and Capital Lease Obligation Current Portion of Long Term Debt and Capital Lease Current Portion of Long Term Debt Other Current Portion of LT Debt Other Current Liabilities Provisions, Current Provision for Employee Entitlements, Current Total Non-Current Liabilities Financial Liabilities, Non-Current Long Term Debt and Capital Lease Obligation Long Term Debt Notes Payables, Non-Current 78 Tax Liabilities, Non-Current Deferred Tax liabilities Non.Current MA Income Statement MA Balance Sheet MA Cash Flow + 6,180,000,000 500,000,000 500,000,000 500,000,000 500,000,000 500,000,000 2,029,000,000 1,877,000,000 1,611,000,000 1,459,000,000 1,451,000,000 71 72 73 74 7,039,000,000 5,424,000,000 5,424,000,000 5,424,000,000 7,849,000,000 5,834,000,000 5,834,000,000 5,834,000,000 5,834,000,000 67,000,000 67.000.000 5,785,000,000 5,180,000,000 5,180,000,000 5,180,000,000 3,938,000,000 3,287,000,000 3,287,000,000 3,287,000,000 2,283,000,000 1,494,000,000 1,494,000,000 1,494,000,000 75 76 77 106,000,000 106.000.000 81,000,000 81.000.000 79,000,000 79.000.000 115,000,000 115.000.000 79 61 @ J - 140% + 3:26 PM 4/26/2020 o la 1) 2 AutoSave Off H 2 S - MA Financial Statements Final Project - MBA615 (2) - Compatibility Mode - Search Darnell Edmond $ - O X Comments File Home Insert Page Layout Formulas Data Review View Help Share 610 : x v fic GA C F 5,834,000,000 5,424,000,000 5,180,000,000 3,287,000,000 1,494,000,000 5,834,000,000 5,424,000,000 5,180,000,000 3,287,000,000 1,494,000,000 5,834,000,000' 5,424,000,000' 5,180,000,000 3,287,000,000 1,494,000,000 5,834,000,000 67,000,000 106,000,000 81,000,000 79,000,000 115,000,000 67,000,000 106,000,000 8 1,000,000 79,000,000 115,000,000 1,877,000,000 1,438,000,000 524,000,000 572,000,000 674,000,000 71,000,000 71,000,000 5,418,000,000 5,497,000,000 5,684,000,000 6,062,000,000 6,824,000,000 5,395,000,000 5,468,000,000 5,656,000,000 6,028,000,000 6,790,000,000 -21,170,000,000 -16,399,000,000 -12,838,000,000 -9,518,000,000 -6,119,000,000 4,580,000,000 4,365,000,000 4,183,000,000 4,004,000,000 3,876,000,000 80 83 86 0 Financial Liabilities, Non-Current Long Term Debt and Capital Lease Obligation Long Term Debt 77 Notes Payables, Non-Current Tax Liabilities, Non-Current 79 Deferred Tax Liabilities, Non-Current Other Non-Current Liabilities 81 Preferred Securities Outside Stock Equity 82 Total Equity Equity Attributable to Parent Stockholders 84 Paid in Capital 85 Capital Stock Common Stock Common Stock, with Par Value Additional Paid in Capital/Share Premium Treasury Stock Retained Earnings/Accumulated Deficit Reserves/Accumulated Comprehensive Income/Losses 92 Cumulative Foreign Exchange Translation Reserves/Accum. Comp. Inc 93 Available for Sale Financial Investments Reserves/Accum. Comp. Inc Pension and Other Post-Retirement Benefit Plans Reserves/Accum. Comp. Inc 95 Non-Controlling/Minority Interests 96 Common Shares Issued 97 Common Shares Outstanding 98 Common Shares Treasury 99 Fiscal year ends in Dec 31 USD 100 MA Income Statement MA Balance Sheet MA Cash Flow + 0 4,580,000,000' 4,365,000,000 4,183,000,000' 4,004,000,000 3,876,000,000 -25,750,000,000 -20,764,000,000 -17,021,000,000 -13,522,000,000 -9,995,000,000 27,283,000,000 22,364,000,000 19,418,000,000 16,222,000,000 13,169,000,000 -718,000,000 -497,000,000 -924,000,000 -676,000,000 -260,000,000 91 94 23,000,000 1,031,000,000 1,031,000,000 368,000,000 29,000,000 1,054,000,000 1,054,000,000 342,000,000 28,000,000 1,081,000,000 1,081,000,000 312,000,000 34,000,000 1,116,000,000 1,116,000,000 275,000,000 34,000,000 1,152,561,805 1,152,561,805 237,008,743 -__ 140% +_ + 3:26 PM 4/26/2020 O fra ) 9 AutoSave Off H 2 S - MA Financial Statements Final Project - MBA615 (2) - Compatibility Mode - Search Darnell Edmond $ - O X File Home Insert Page Layout Formulas Data Review View Help Share Comments F13 E 2 B C D E F 2018 2017 2016 2016 2015 2015 2014 6,223,000,000 5,555,000,000 4,484,000,000 4,043,000,000 3,407,000,000 6,223,000,000 5,555,000,000 4,484,000,000 4,043,000,000 3,407,000,000 6,223,000,000 5,555,000,000 4,484,000,000 4,043,000,000 3,407,000,000 5,859,000,000 3,915,000,000 4,059,000,000 3,808,000,000 3,617,000,000 1,677,000,000 1,926,000,000 1,292,000,000 1,055,000,000 958,000,000 459,000,000 437,000,000 373,000,000 366,000,000 321,000,000 459,000,000 437,000,000 373,000,000 366,000,000 321,000,000 196,000,000 176,000,000 50,000,000 22,000,000 -15,000,000 -244,000,000 86,000,000 -20,000,000 -16,000,000 -91,000,000 1,266,000,000 1,227,000,000 889,000,000 683,000,000 743,000,000 : x v for A Name Cash Flow from Operating Activities, Indirect Net Cash Flow from Continuing Operating Activities, Indirect Cash Generated from Operating Activities Income/Loss before Non-Cash Adjustment Total Adjustments for Non-Cash Items Depreciation, Amortization and Depletion, Non-Cash Adjustment Depreciation and Amortization, Non-Cash Adjustment Stock-Based Compensation, Non-Cash Adjustment Taxes, Non-Cash Adjustment Other Non-Cash Items Excess Tax Benefit from Stock-Based Compensation, Non-Cash Adjustment Net Investment Income/Loss, Non-Cash Adjustment Gain/Loss on Financial Instruments, Non-Cash Adjustment Irregular Income/Loss, Non-Cash Adjustment Gain/Loss on Disposals, Non-Cash Adjustment Impairment/Write Off/ Write Down of Capital Assets Loss/Reversal, Non-Cash Adjustment Changes in Operating Capital Change in Trade and Other Receivables Change in Trade/Accounts Receivable Change in Tax Receivables Change in Other Receivables Change in Prepayments and Deposits Change in Cash Restricted or Pledged Change in Payables and Accrued Expenses Change in Trade and Other Payables Change in Trade/Accounts Payable MA Income Statement MA Balance Sheet MA Cash Flow -1,313,000,000' 286,000,000 -1,515,000,000'-726,000,000 -1,395,000,000 -726,000,000 -120,000,000 -867,000,000 -349,000,000 -348,000,000 -1,000,000 -820,000,000 -1,168,000,000 -147,000,000 13,000,000 -133,000,000 21,000,000 -14,000,000 -8,000,000 -802,000,000 ' -1,316,000,000 '-1,769,000,000 ' -1,402,000,000 -1,073,000,000 -6,000,000 2,238,000,000 1,835,000,000 748,000,000 930,000,000 1,261,000,000 211,000,000 950 000 000 684 000 000 211 000 000 125,000,000 -137,000,000 137 000 000 170,000,000 -104,000,000 104.000.000 27 1 Ready 2 - + 140% 3:28 PM 1 + 0 0 O BI ra 1) 9 1/26/2020 AutoSave Off H 2 S - MA Financial Statements Final Project - MBA615 (2) - Compatibility Mode - Search Darnell Edmond $ - O X File Home Insert Page Layout Formulas Data Review View Help Share Comments F13 : x v fic D 211,000,000 -137,000,000 -104,000,000 B 950,000,000 -20,000,000 1,308,000,000 -261,000,000 C 684,000,000 577,000,000 574,000,000' 7,000,000 537,000,000 -193,000,000 262,000,000 4,000,000 274,000,000 -35,000,000 32 34 37 0 Change in Trade/Accounts Payable Change in Taxes Payable Change in Accrued Expenses Change in Other Operating Capital 31 Change in Other Current Liabilities Change in Other Current Assets 33 Cash Flow from Investing Activities | Cash Flow from Continuing Investing Activities Capital Expenditure, Reported 36 Purchase/Sale and Disposal of Property, Plant and Equipment, Net Purchase of Property, Plant and Equipment Purchase/Sale of Business, Net 39 Purchase/Acquisition of Business 40 Purchase/Sale of Equity Investments Purchase of Joint Venture/Associate 42 Purchase/Sale of Investments, Net 43 Purchase of Investments 44 Sale of Investments 45 Other Investing Cash Flow Change in Restricted Cash and Cash Equivalents 47 Purchase/Sale of Intangibles, Net 48 Purchase of Intangibles 49 Cash Flow from Financing Activities Cash Flow from Continuing Financing Activities 51 Issuance of/Payments for Common Stock, Net 52 Payments for Common Stock 53 Issuance of/Renavments for Debt Net MA Income Statement MA Balance Sheet MA Cash Flow -506,000,000 -1,779,000,000 -1,167,000,000 -715,000,000 690,000,000 -506,000,000 -1,779,000,000'-1,167,000,000 -715,000,000 690,000,000 -174,000,000 -123,000,000 -167,000,000 -165,000,000 -159,000,000 -330,000,000 -300,000,000 215,000,000 177,000,000 -175,000,000 -330,000,000 -300,000,000 -215,000,000 -177,000,000 -175,000,000 0 -1,175,000,000 -584,000,000 -525,000,000 0 -1,175,000,000 0 -584,000,000 -525,000,000 -91,000,000 -147,000,000 -91,000,000 -147,000,000 103,000,000 -35,000,000 -752,000,000 210,000,000 1,450,000,000 -1,809,000,000 -1,859,000,000 -1,824,000,000 -1,892,000,000 -2,385,000,000 1,912,000,000 1,824,000,000 1,072,000,000 2,102,000,000 3,835,000,000 -14,000,000 1,000,000 -31,000,000 2,000,000 -84,000,000 -2,000,000 -1,000,000 183,000,000 41 46 50 -4,966,000,000 -4,764,000,000 -2,293,000,000 -2,458,000,000 -2,339,000,000 -4,966,000,000 -4,764,000,000 -2,293,000,000 -2,458,000,000 -2,339,000,000 4,933,000,000 -3,762,000,000 -3,511,000,000 -3,518,000,000 -3,386,000,000 4,933,000,000 -3,762,000,000 -3,511,000,000 -3,518,000,000 -3,386,000,000 991 000 000 64.000.000 1972 000 000 1 735 000 000 1530.000.000 Ready 2 - 140% + 3:28 PM 4/26/2020 AutoSave Off H 2 S - MA Financial Statements Final Project - MBA615 (2) - Compatibility Mode - Search Darnell Edmond $ - O X File Home Insert Page Layout Formulas Data Review View Help Share Comments 43 B C D E - F 103,000,000 -35,000,000 -752,000,000 210,000,000 1,450,000,000 -1,809,000,000'-1,859,000,000 -1,824,000,000 -1,892,000,000 -2,385,000,000 1,912,000,000 1,824,000,000 1,072,000,000 2,102,000,000 3,835,000,000 -14,000,000 1,000,000 -31,000,000 2,000,000 -84,000,000 -2,000,000 -1,000,000 183,000,000 45 48 F13 : x v fic A 42 Purchase/Sale of Investments, Net Purchase of Investments 44 Sale of Investments Other Investing Cash Flow 46 Change in Restricted Cash and Cash Equivalents 47 Purchase/Sale of Intangibles, Net Purchase of Intangibles 49 Cash Flow from Financing Activities Cash Flow from Continuing Financing Activities 51 Issuance of/Payments for Common Stock, Net Payments for Common Stock 53 Issuance of/Repayments for Debt, Net Issuance of/Repayments for Long Term Debt, Net Proceeds from Issuance of Long Term Debt Repayments for Long Term Debt Cash Dividends and Interest Paid 58 Cash Dividends Paid 59 Common Stock Dividends Paid 60 Excess Tax Benefit from Share-Based Compensation, Financing Activities Proceeds from Issuance/Exercising of Stock Options/Warrants 62 Other Financing Cash Flow 63 Cash and Cash Equivalents, End of Period 64 Change in Cash Effect of Exchange Rate Changes 66 Cash and Cash Equivalents, Beginning of Period 67 Change in Cash As Reported, Supplemental 54 56 57 -4,966,000,000 -4,764,000,000 -2,293,000,000 -2,458,000,000 -2,339,000,000 -4,966,000,000 -4,764,000,000 -2,293,000,000 -2,458,000,000 -2,339,000,000 4,933,000,000 -3,762,000,000 -3,511,000,000 -3,518,000,000 -3,386,000,000 -4,933,000,000 -3,762,000,000 -3,511,000,000 -3,518,000,000 3,386,000,000 991,000,000 -64,000,000 1,972,000,000 1,735,000,000 1,530,000,000 991,000,000 -64,000,000 1,972,000,000 1,735,000,000 1,530,000,000 991,000,000 '1,972,000,000 1,735,000,000 1,530,000,000 0 -64,000,000 -1,044,000,000' -942,000,000' -837,000,000 727,000,000' -515,000,000 -1,044,000,000 -942,000,000 -837,000,000'-727,000,000' -515,000,000 -1,044,000,000 -942,000,000 -837,000,000 -727,000,000 -515,000,000 48,000,000 42,000,000 54,000,000 104,000,000 57,000,000 37,000,000 27,000,000 28,000,000 -84,000,000 -53,000,000 -2,000,000 -17,000,000 -50,000,000 8,337,000,000 5,933,000,000 6,721,000,000 5,747,000,000 5,137,000,000 751,000,000 -988,000,000 1,024,000,000 870,000,000 1,758,000,000 -6,000,000 200,000,000 -50,000,000 260,000,000 -220,000,000 7,592,000,000 6,721,000,000 5,747,000,000 5,137,000,000 3,599,000,000 745,000,000 -788,000,000' 974,000,000' 610,000,000' 1,538,000,000 61 65 68 MA Income Statement MA Balance Sheet MA Cash Flow + + Ready - + 140% 3:28 PM 0 fra )) 1/26/2020 Name 2 Total Assets Total Current Assets Cash, Cash Equivalents and Short Term Investments Cash and Cash Equivalents Short Term Investments Trading Listed Investments, Current Available-for-Sale Securities, Current Cash Restricted or Pledged, Current Trade and Other Receivables, Current Trade/Accounts Receivable, Current Other Receivables, Current Taxes Receivable, Current Prepayments and Deposits Current Other Current Assets Derivative Investment and Hedging Assets, Current 17 Deferred Tax Assets, Current 18 Deferred Costs/Assets, Current 19 Total Non-Current Assets 20 Net Property, Plant and Equipment Gross Property, plant and Equipment Properties Land and Improvements Buildings and improvements Machinery, Furniture and Equipment Furniture, Fixtures and Office Equipment Construction in Progress and Advance Payments Accumulated Depreciation and Impairment Accumulated Depreciation Net Intangible Assets 7 2018 2017 2016 2015 2014 | 69,225,000,000 67,977,000,000 64,035,000,000 40,236,000,000 38,569,000,000 18,216,000,000 19,023,000,000 14,313,000,000'10,892,000,000 9,562,000,000 (11,709,000,000 13,438,000,000 8,938,000,000 6,015,000,000 3,950,000,000 8,162,000,000' 9,874,000,000' 5,619,000,000 3,518,000,000 1,971,000,000 3,547,000,000 3,564,000,000 3,319,000,000 2,497,000,000 1,979,000,000 98,000,000 82,000,000 71,000,000 66,000,000 69,000,000 73.449,000,000 3,482,000,000 3,248,000,000 2,431,000,000 1.910.000.000 2,815,000,000 2,137,000,000 2,028,000,000 2,095,000,000 2,459,000,000 2,790,000,000 2,554,000,000 2,740,000.000 1.332.000.000 1.699.000.000 1,208,000,000 1,132,000,000 1,041,000,000 847,000,000 822,000,000 1,582,000,000 1,422,000,000 1,467,000,000 408.000.000 786,000,000 232,000,000' 77,000,000 91,000,000 562,000,000' 550,000,000' 151,000,000 137,000,000 103,000,000 340,000,000 344,000,000 406,000,000 366,000,000 283,000,000 50,000,000 76,000,000 40,000,000 871,000,000 1,028,000,000 (51,009,000,000 48,954,000,000 49,722,000,000 29,344,000,000 29,007,000,000 12,472,000,000 2,253,000,000 2,150,000.000 1.888.000.000 1.892.000.000 Y 5,697,000,000 5,143,000,000 4,798,000,000 4,283,000,000 3,915,000,000 967,000,000' 937,000,000' 913,000,000 874,000,000 858,000,000 69,000,000 72,000,000 74,000,000 71,000,000 71,000,000 898,000,000' 865,000,000' 839,000,000' 803,000,000 787,000,000 14,577,000,000 4,067,000,000 3,760,000,000 3,289,000,000 2,981,000,000 4.577,000,000 4,067,000,000 3,760,000,000 3,289,000,000 2.981,000,000 153,000,000' 139,000,000 125,000,000 120,000,000 76,000,000 1-3,225,000,000 -2,890,000,000 -2.648,000,000 -2,395,000,000 -2,023,000,000 7-3,225,000,000 -2,890,000,000 2,648,000,000 -2,395,000,000 2,023,000,000 142,752,000,000'42,958,000,000 " 42,300,000,000 23,185,000,000 23,164,000,000 Gross Goodwil and Other Intangible Assets Goodwill Intangibles
Step by Step Solution
There are 3 Steps involved in it
Step: 1

Get Instant Access to Expert-Tailored Solutions
See step-by-step solutions with expert insights and AI powered tools for academic success
Step: 2

Step: 3
Ace Your Homework with AI
Get the answers you need in no time with our AI-driven, step-by-step assistance
Get Started
Capital Flows And Foreign Direct Investments In Emerging Markets
Authors: S. MotamenSamadian
1st Edition
1403991545,0230597963