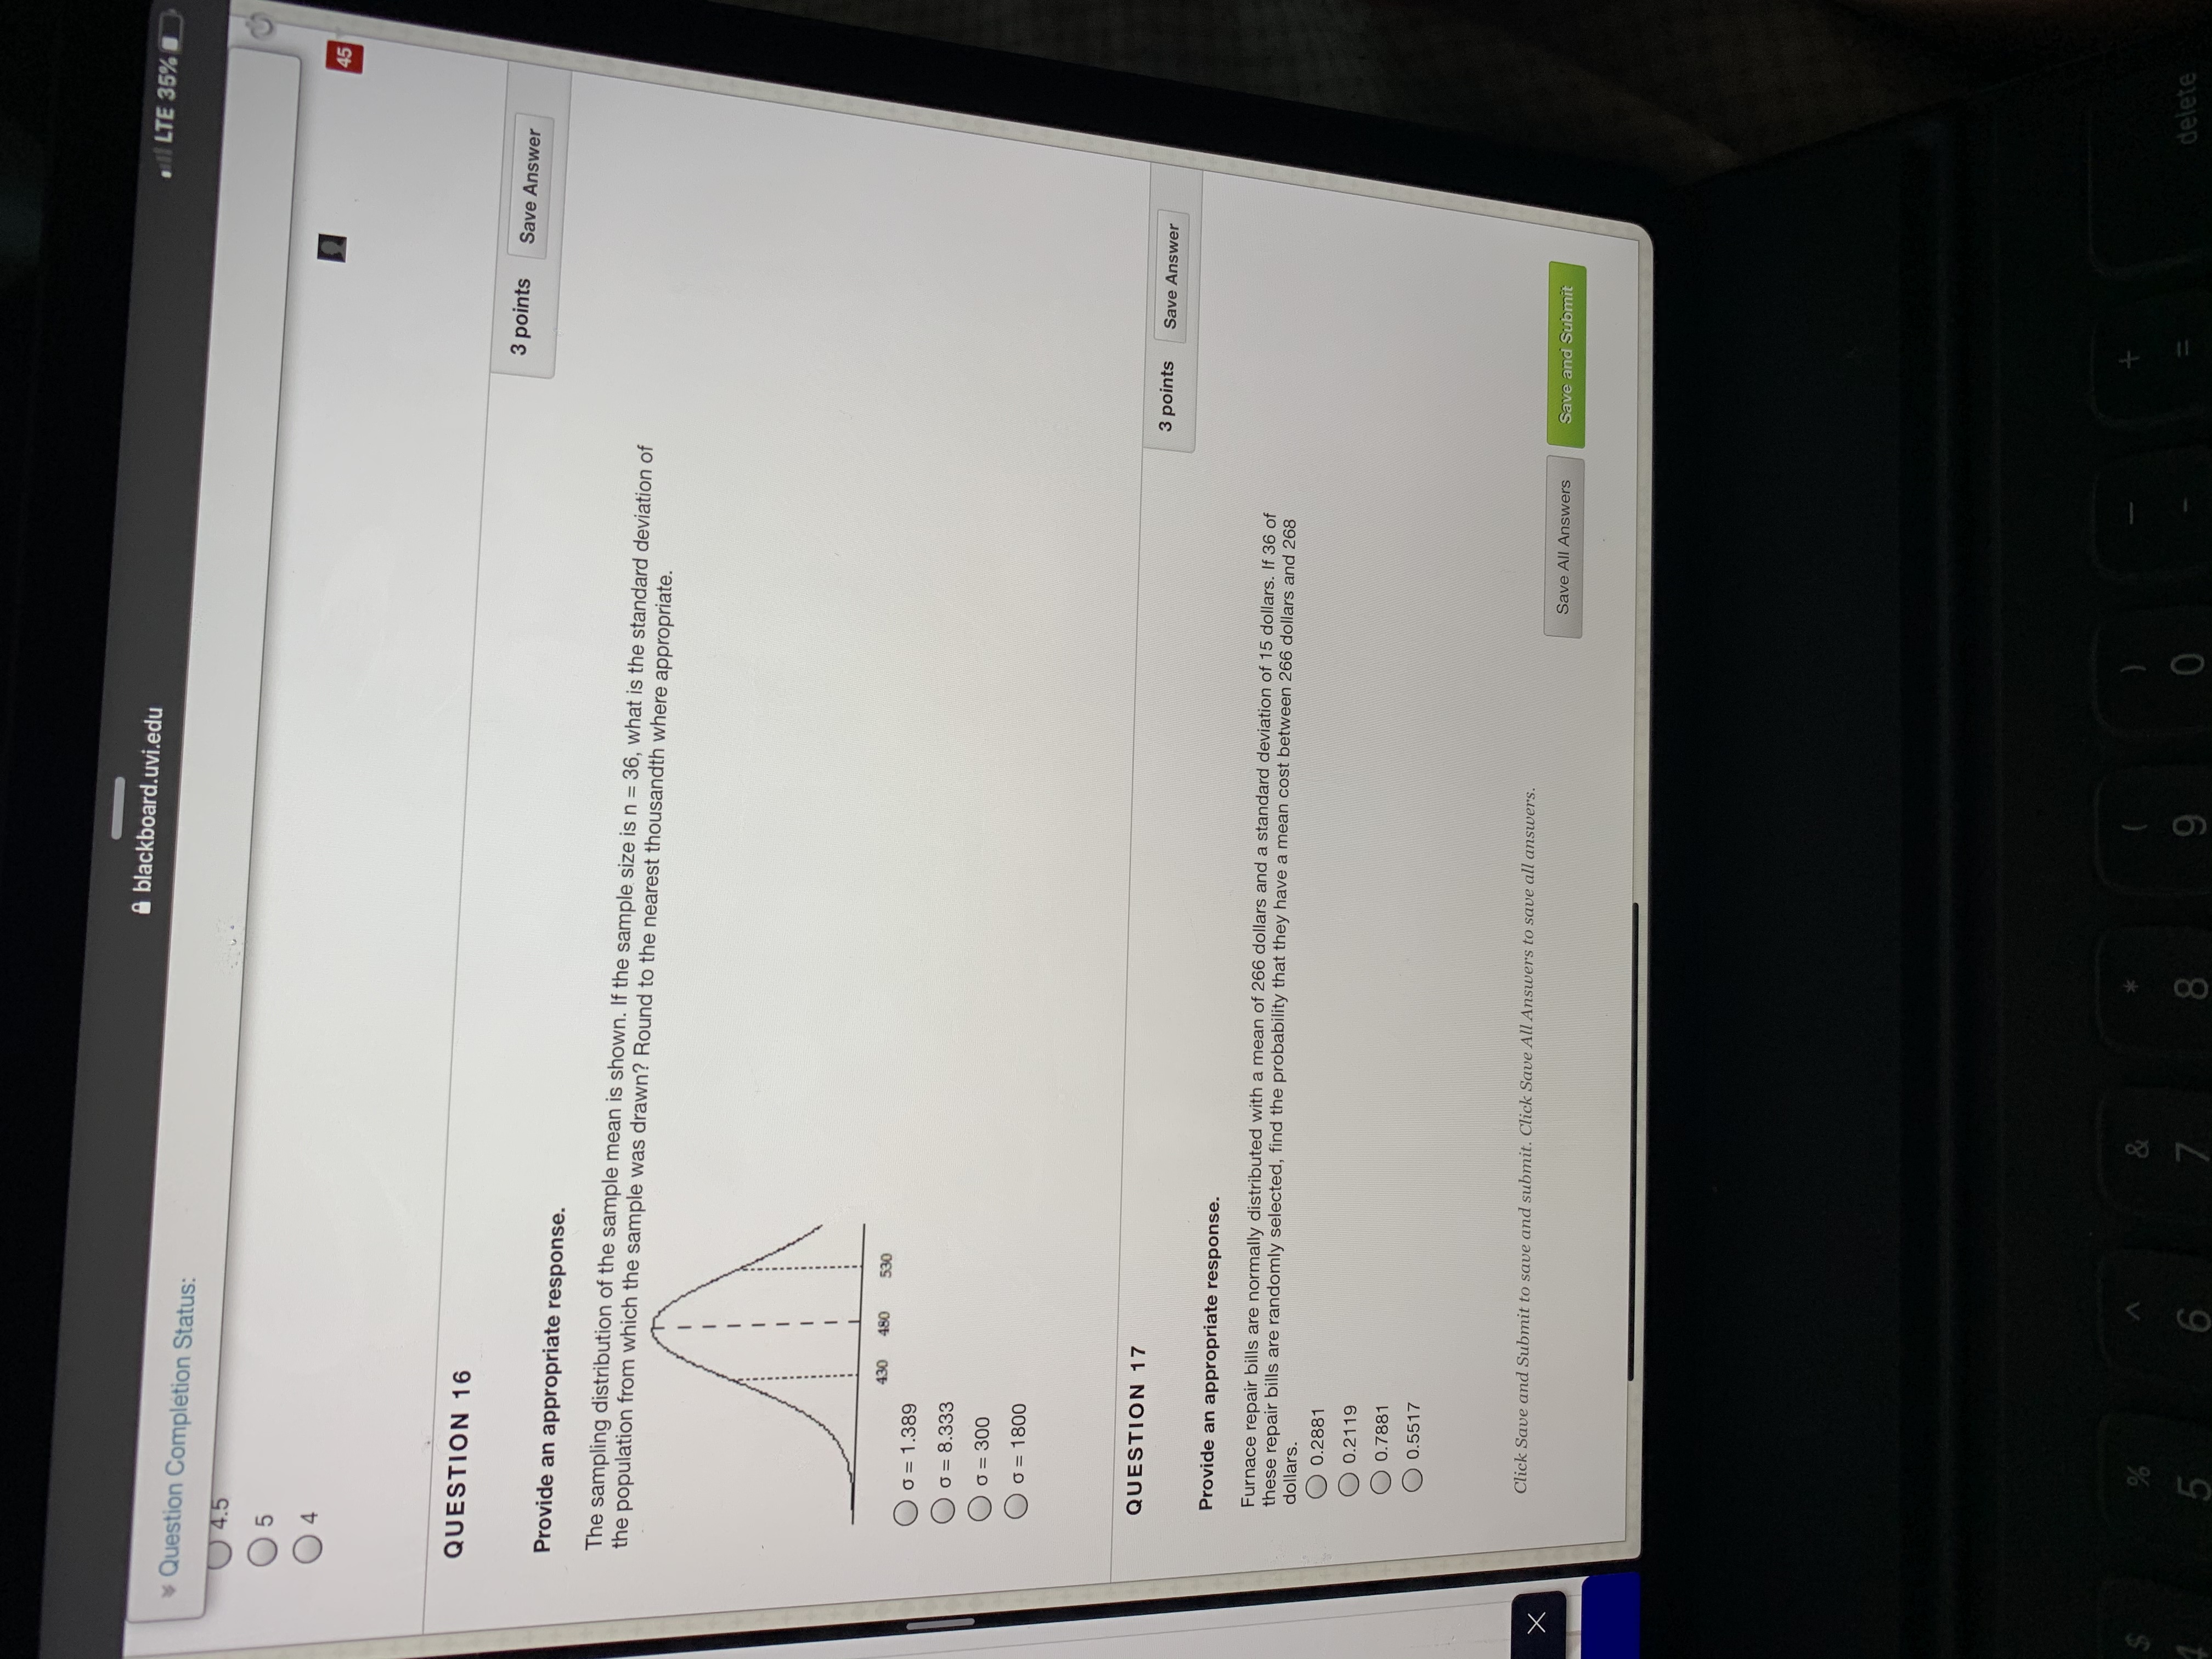
Can someone help me with questions 6-7, and 10-17 please?
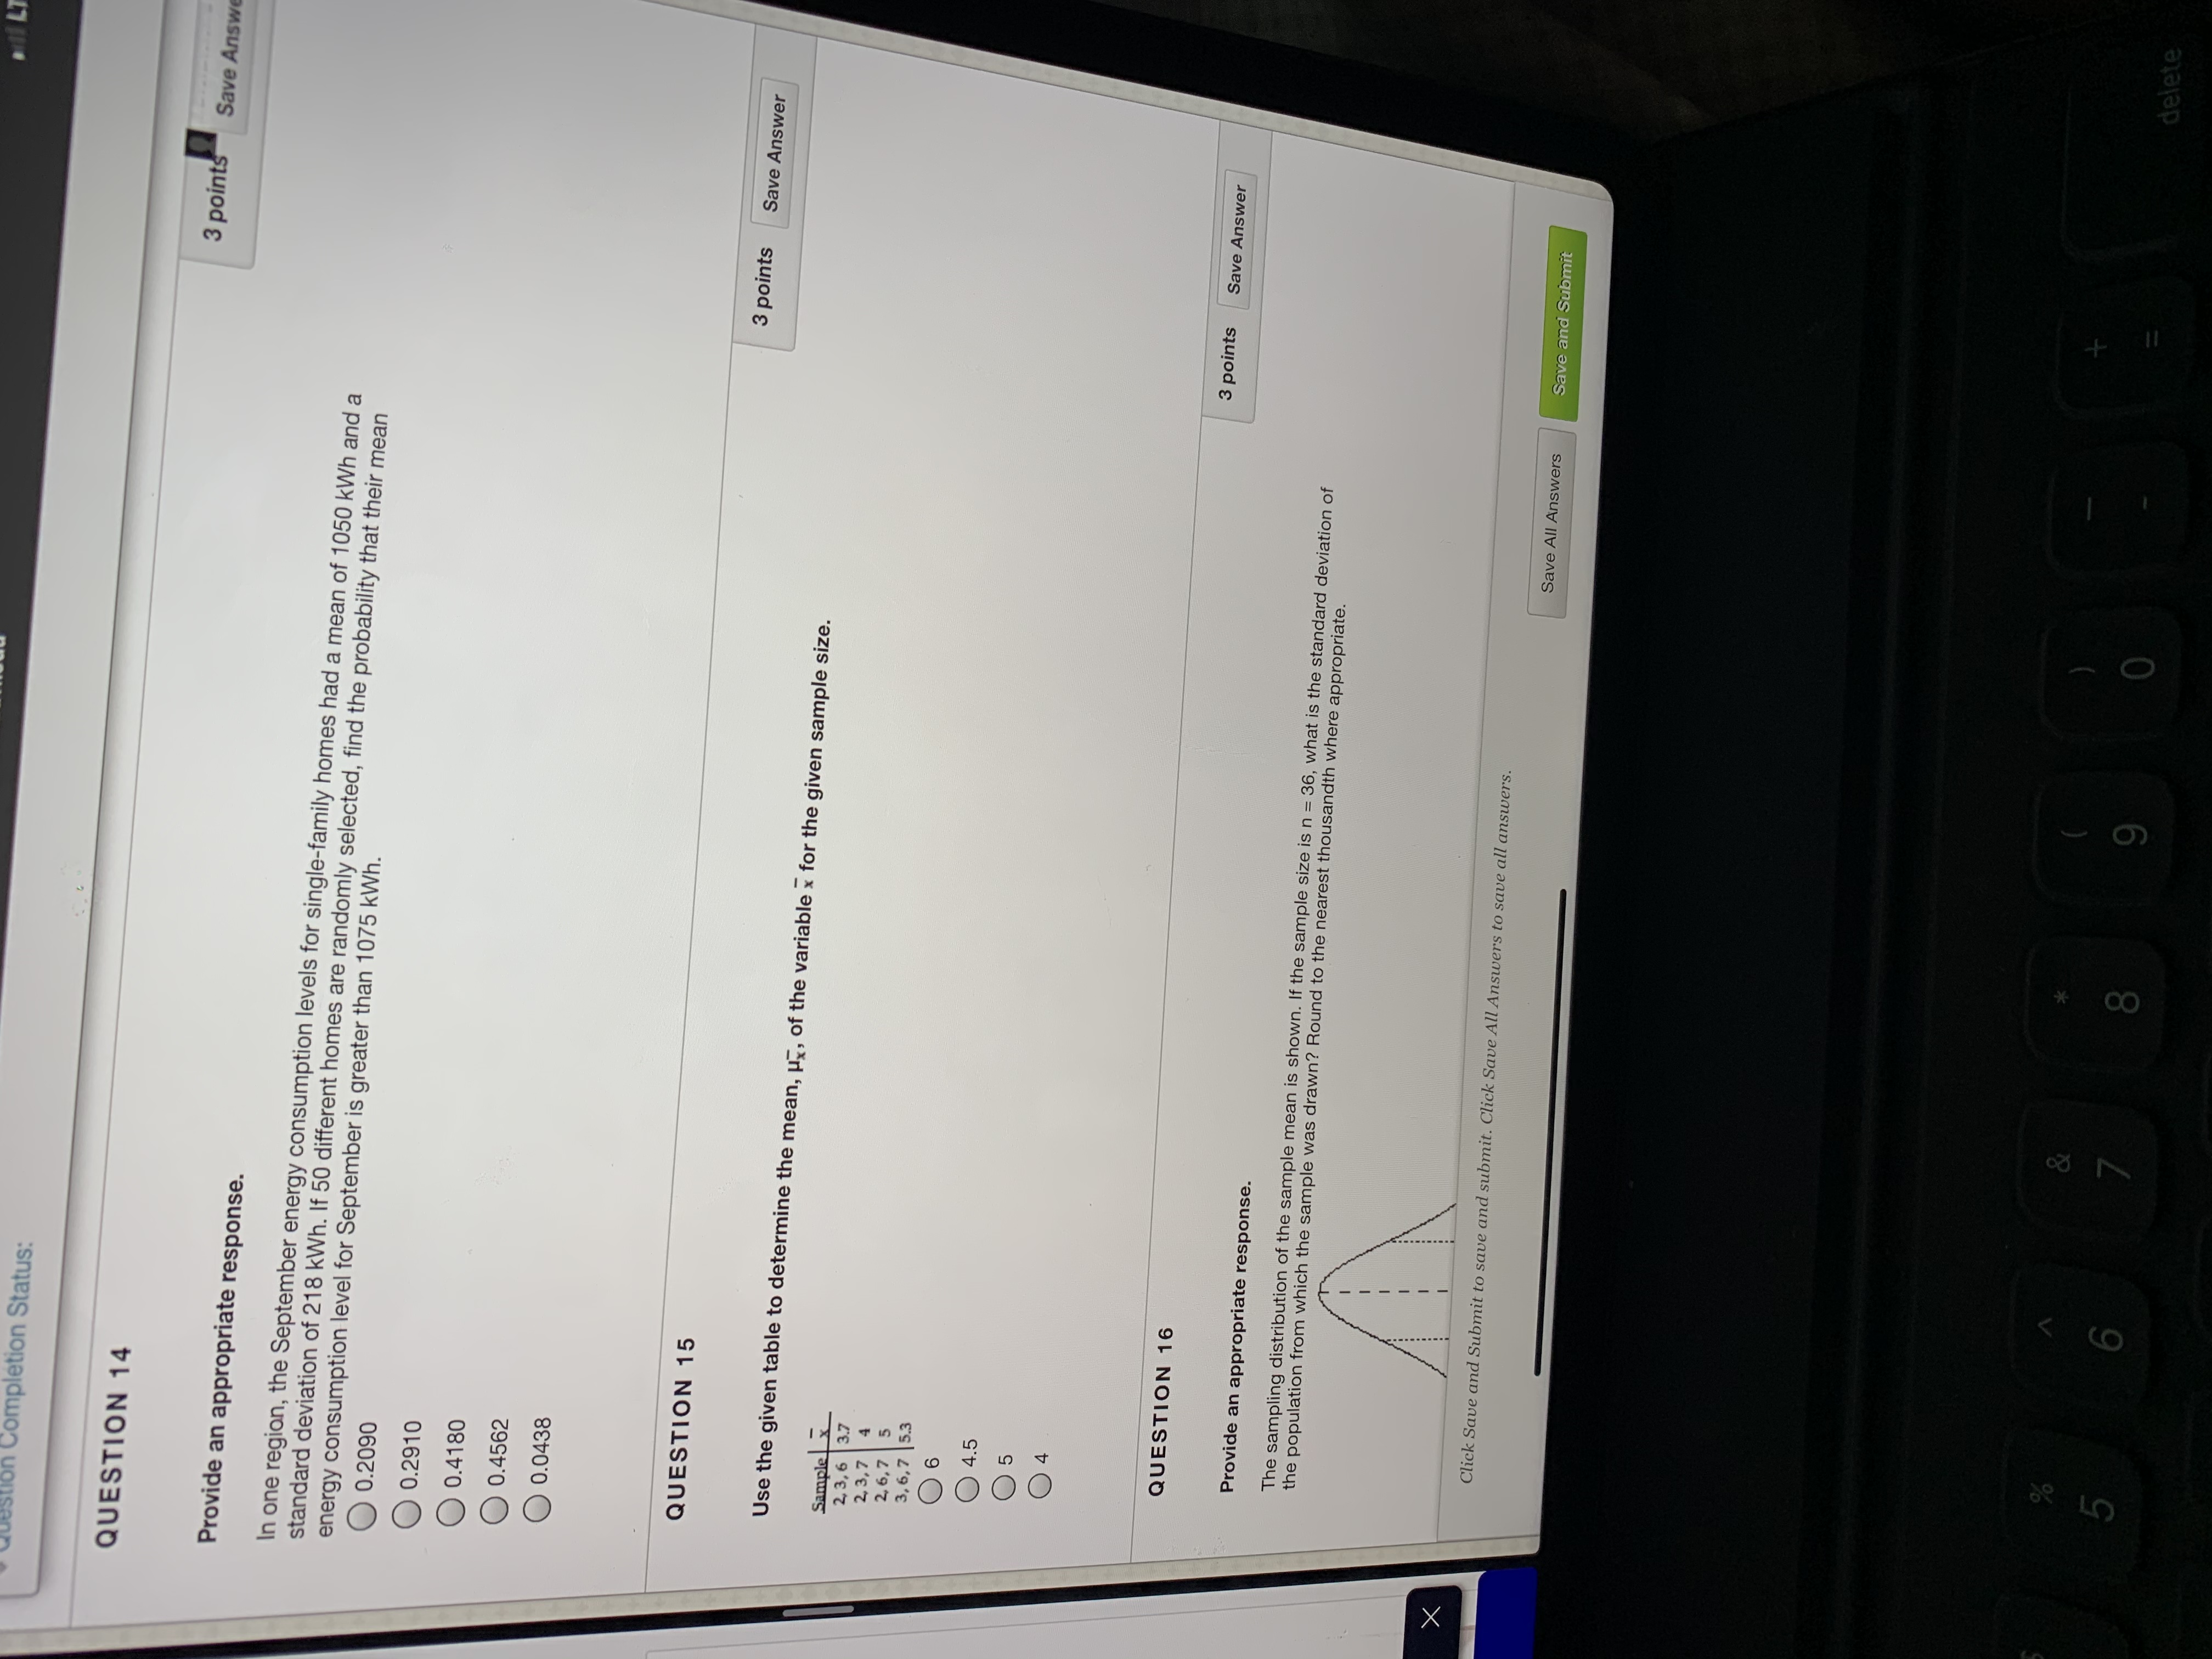
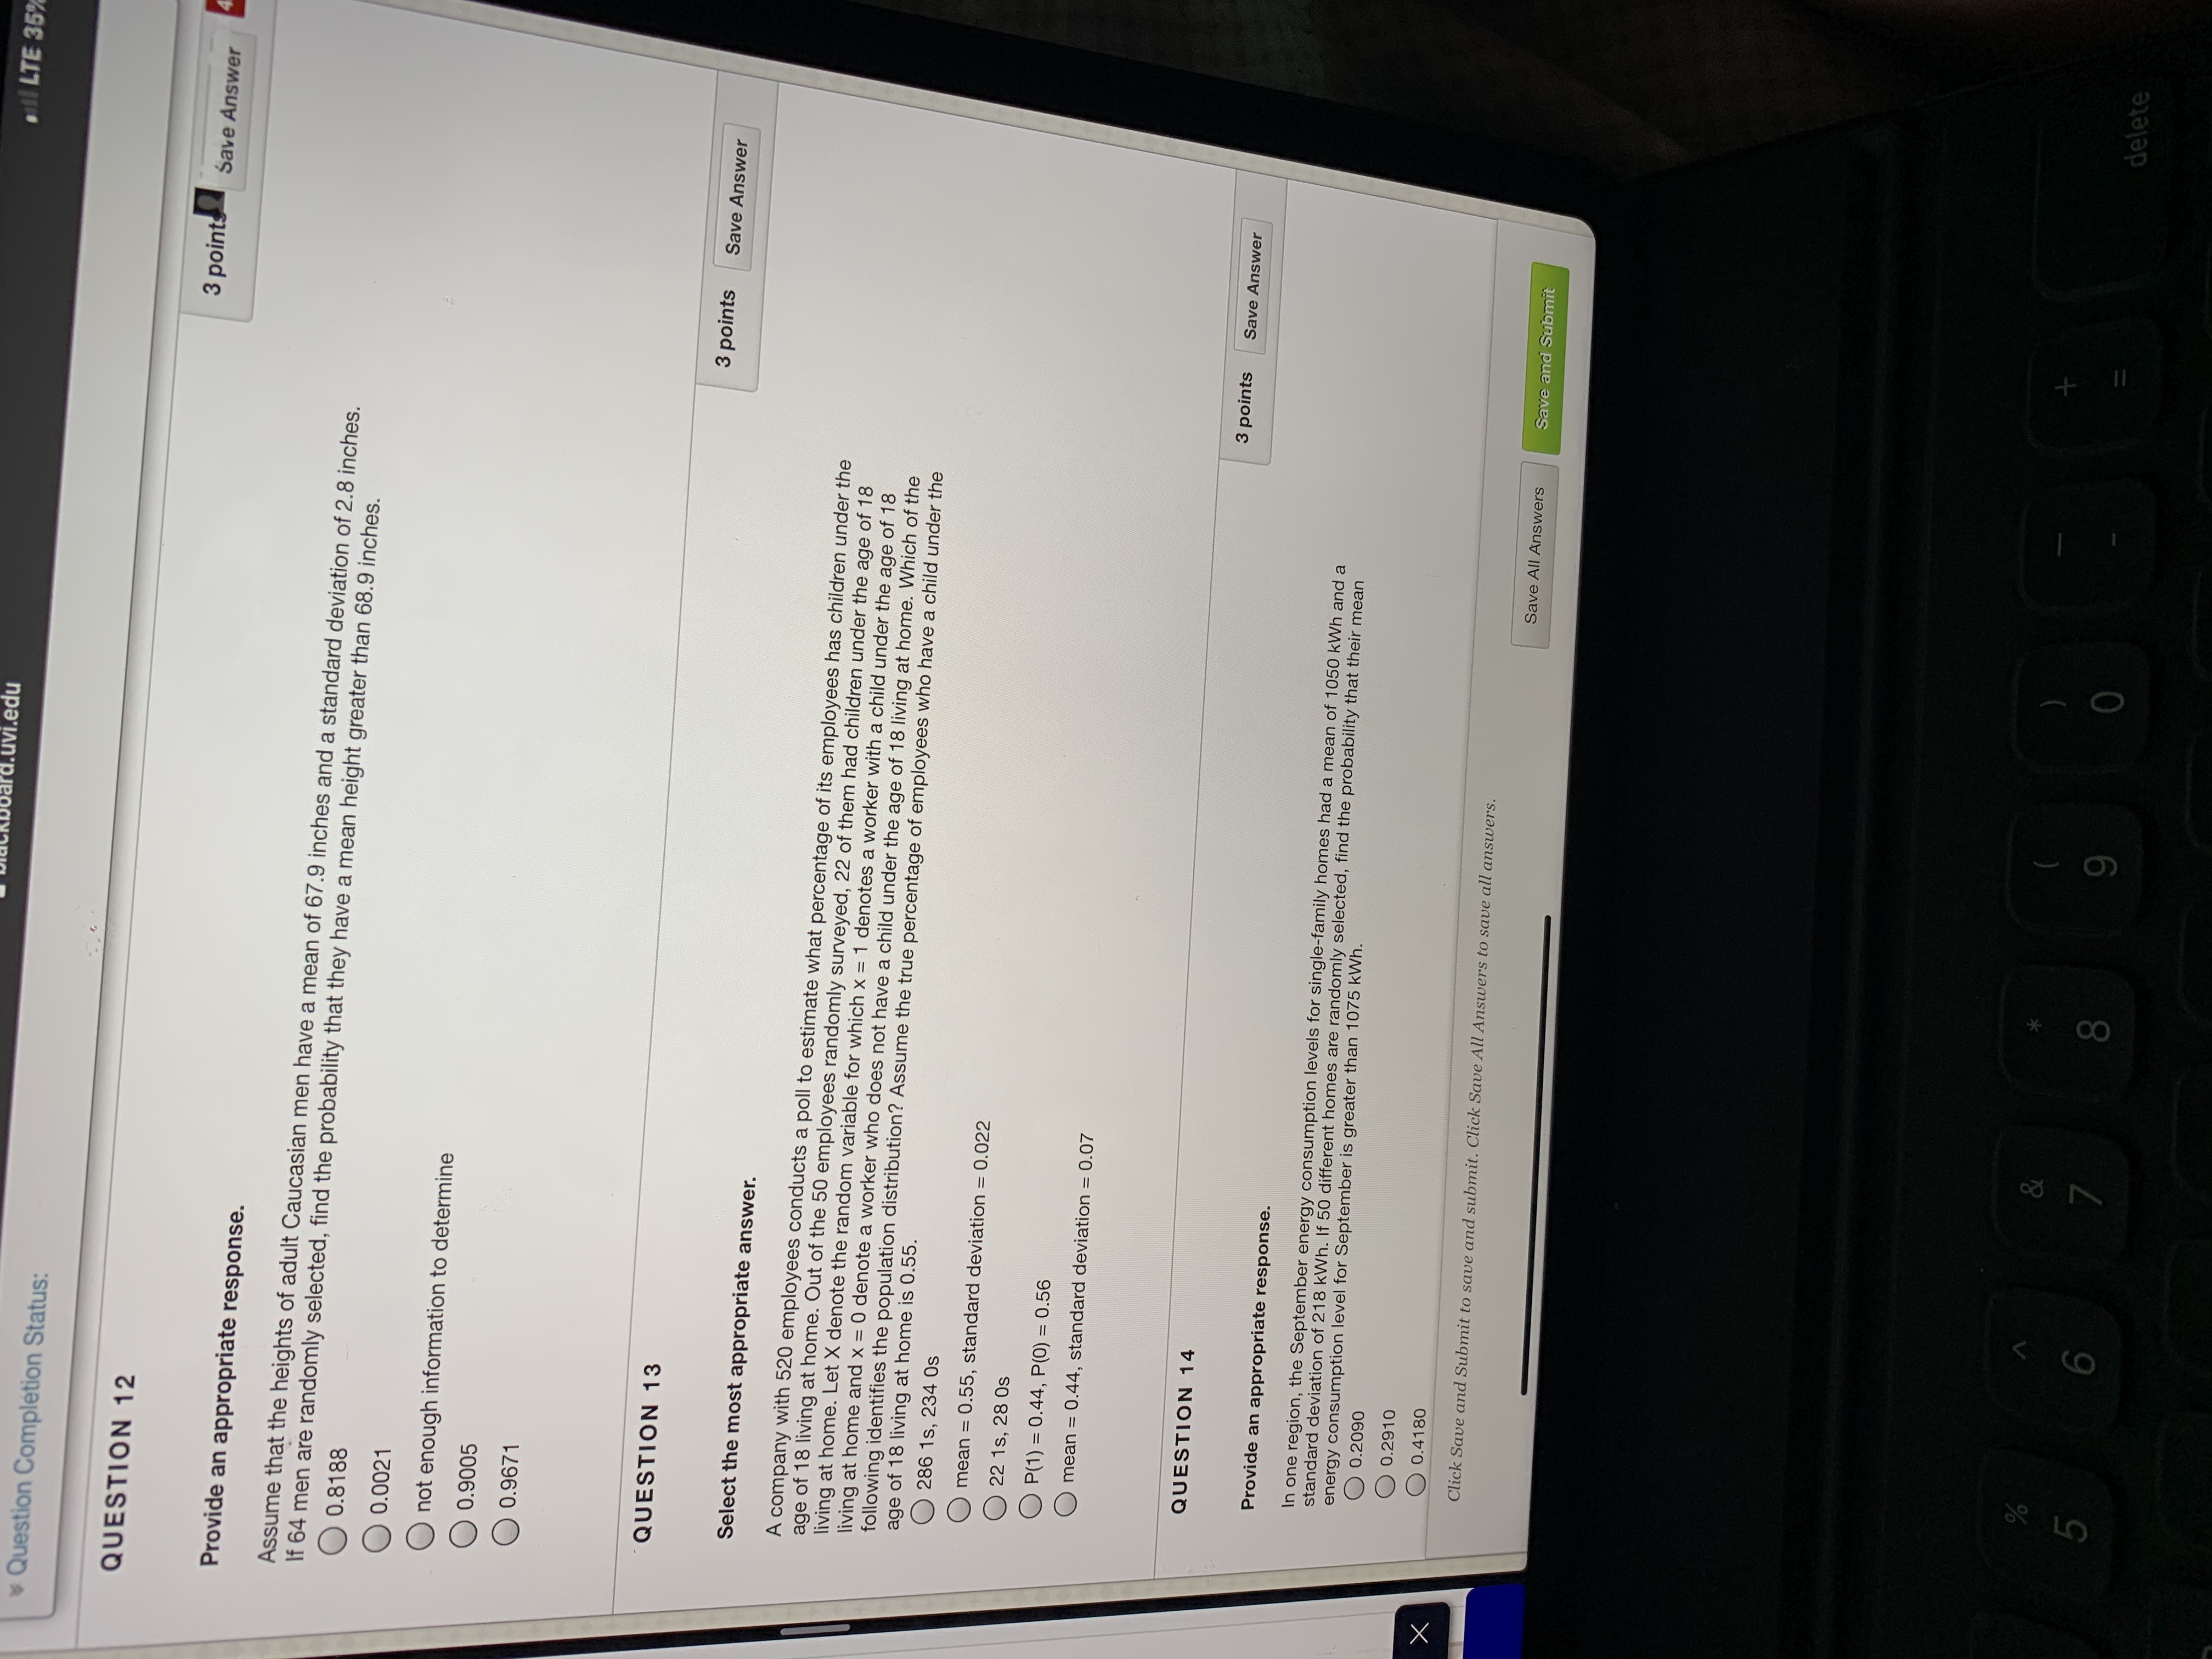
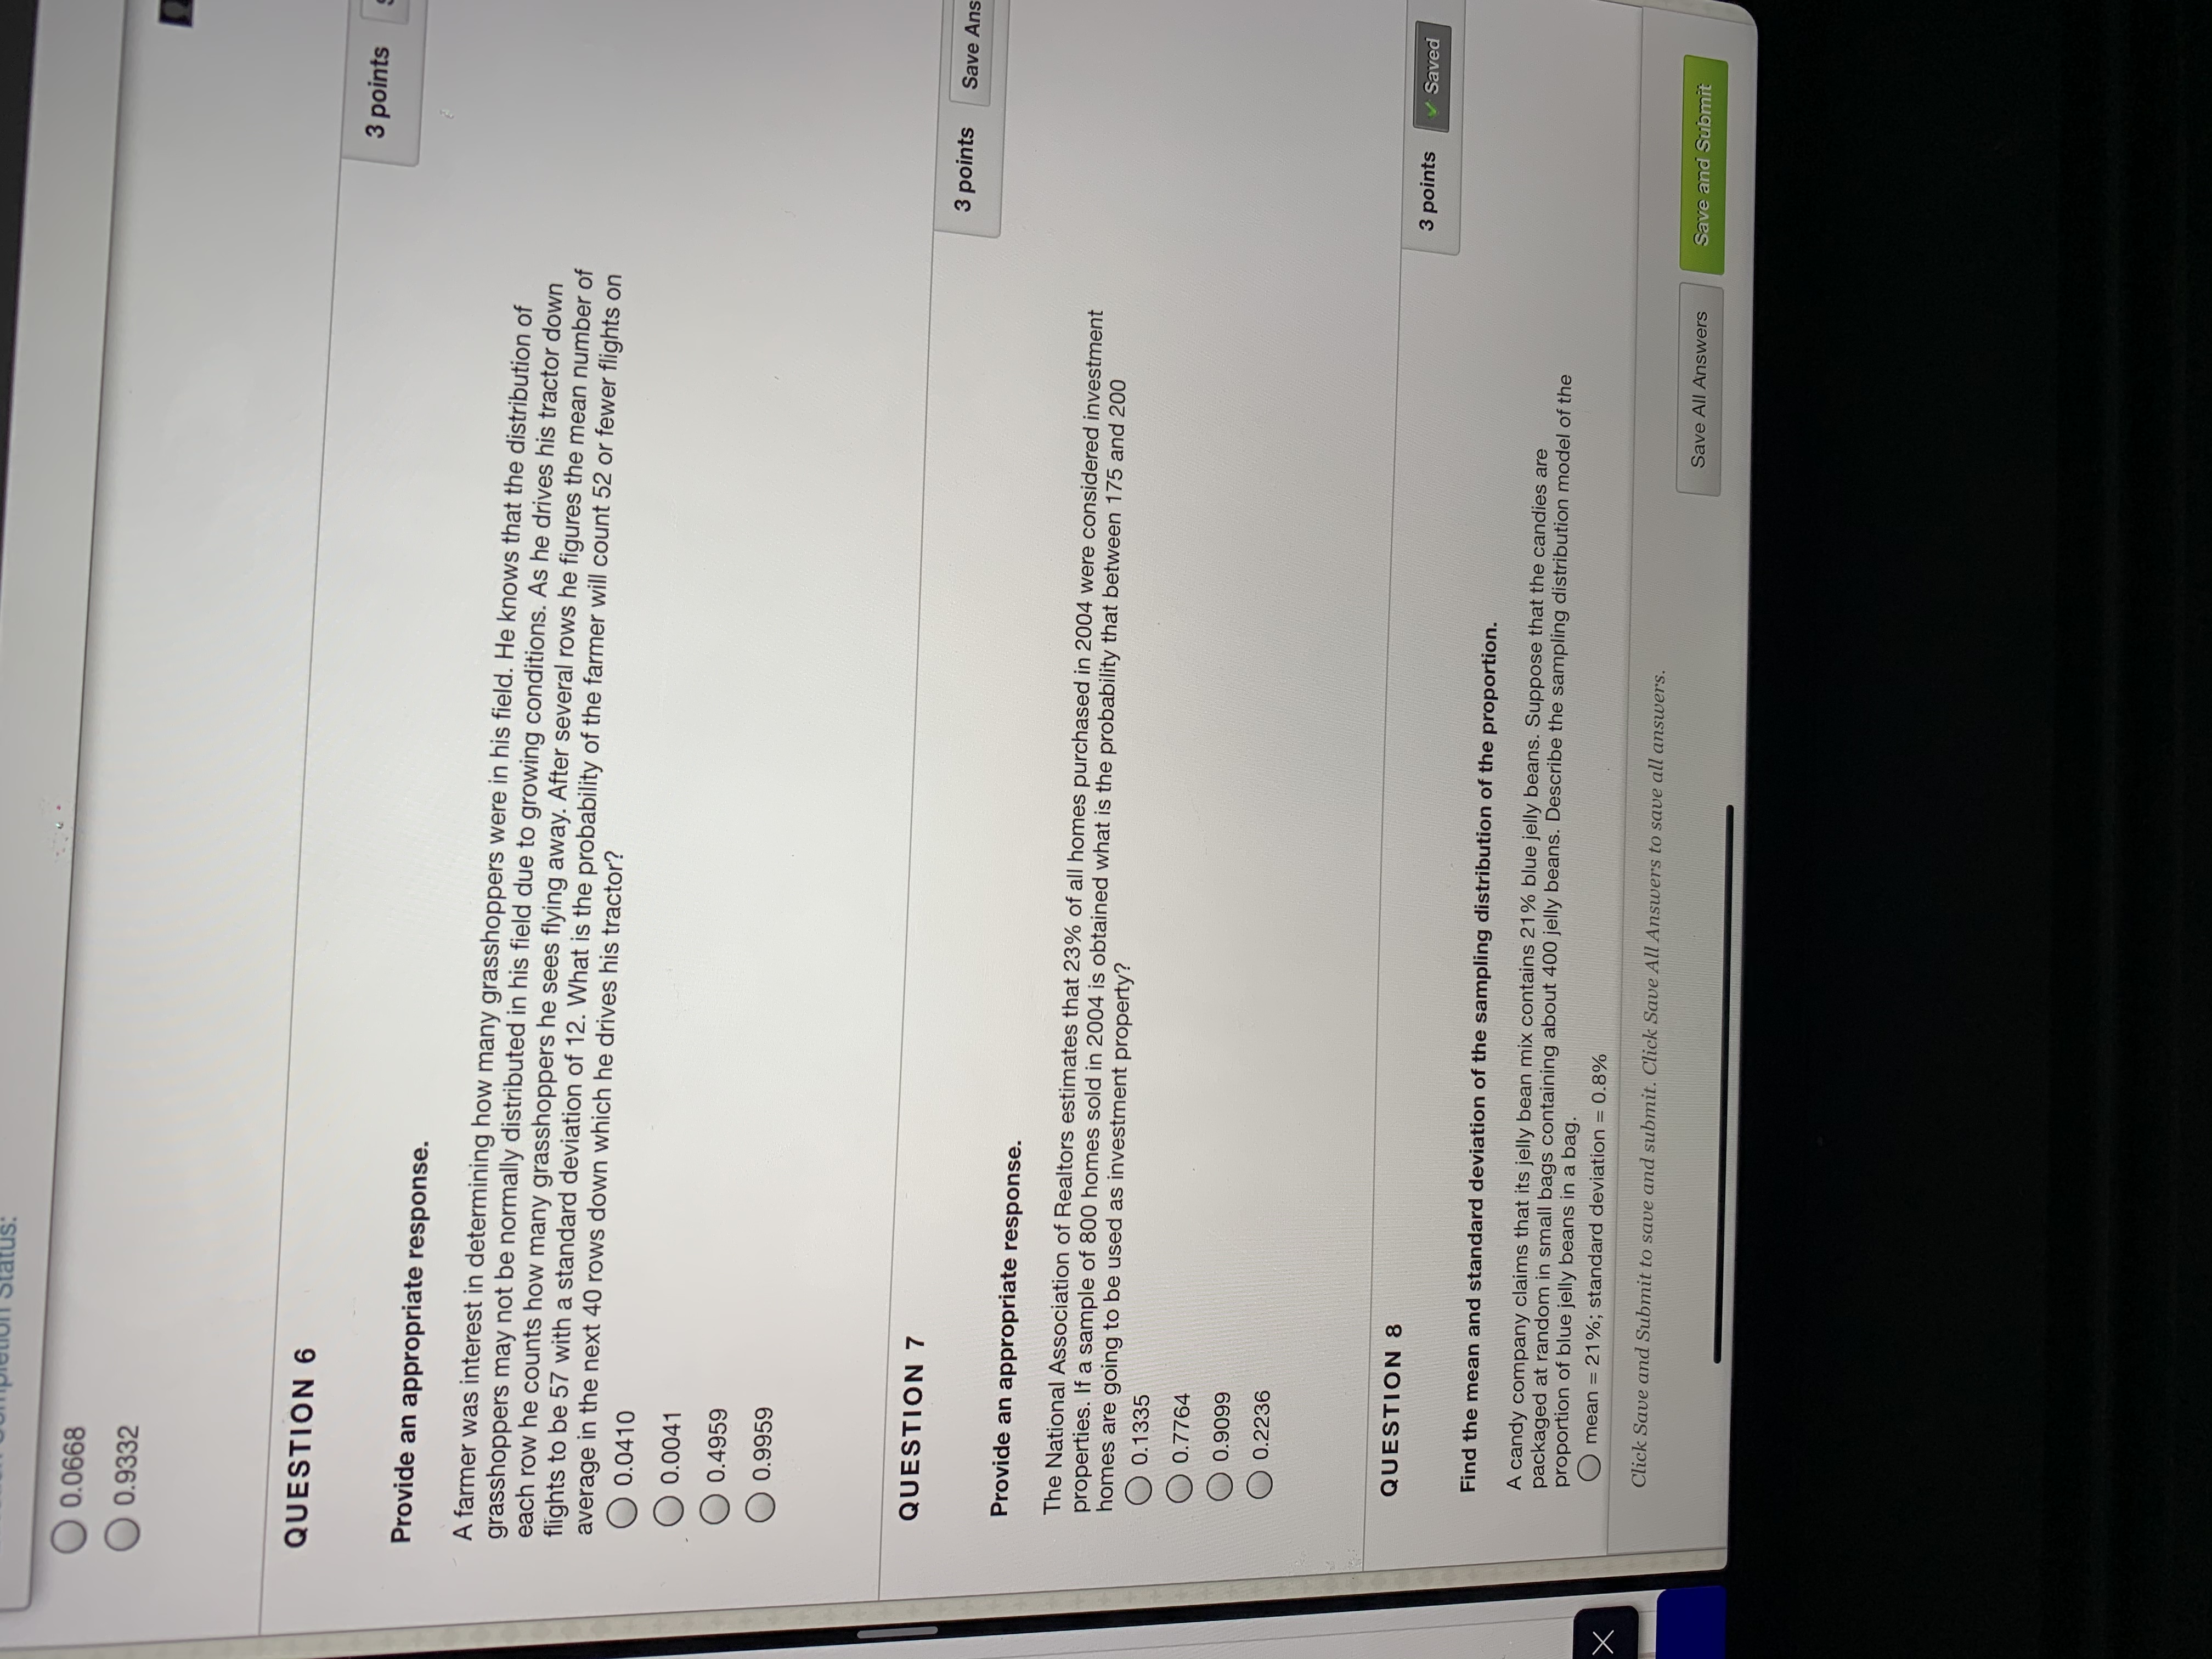
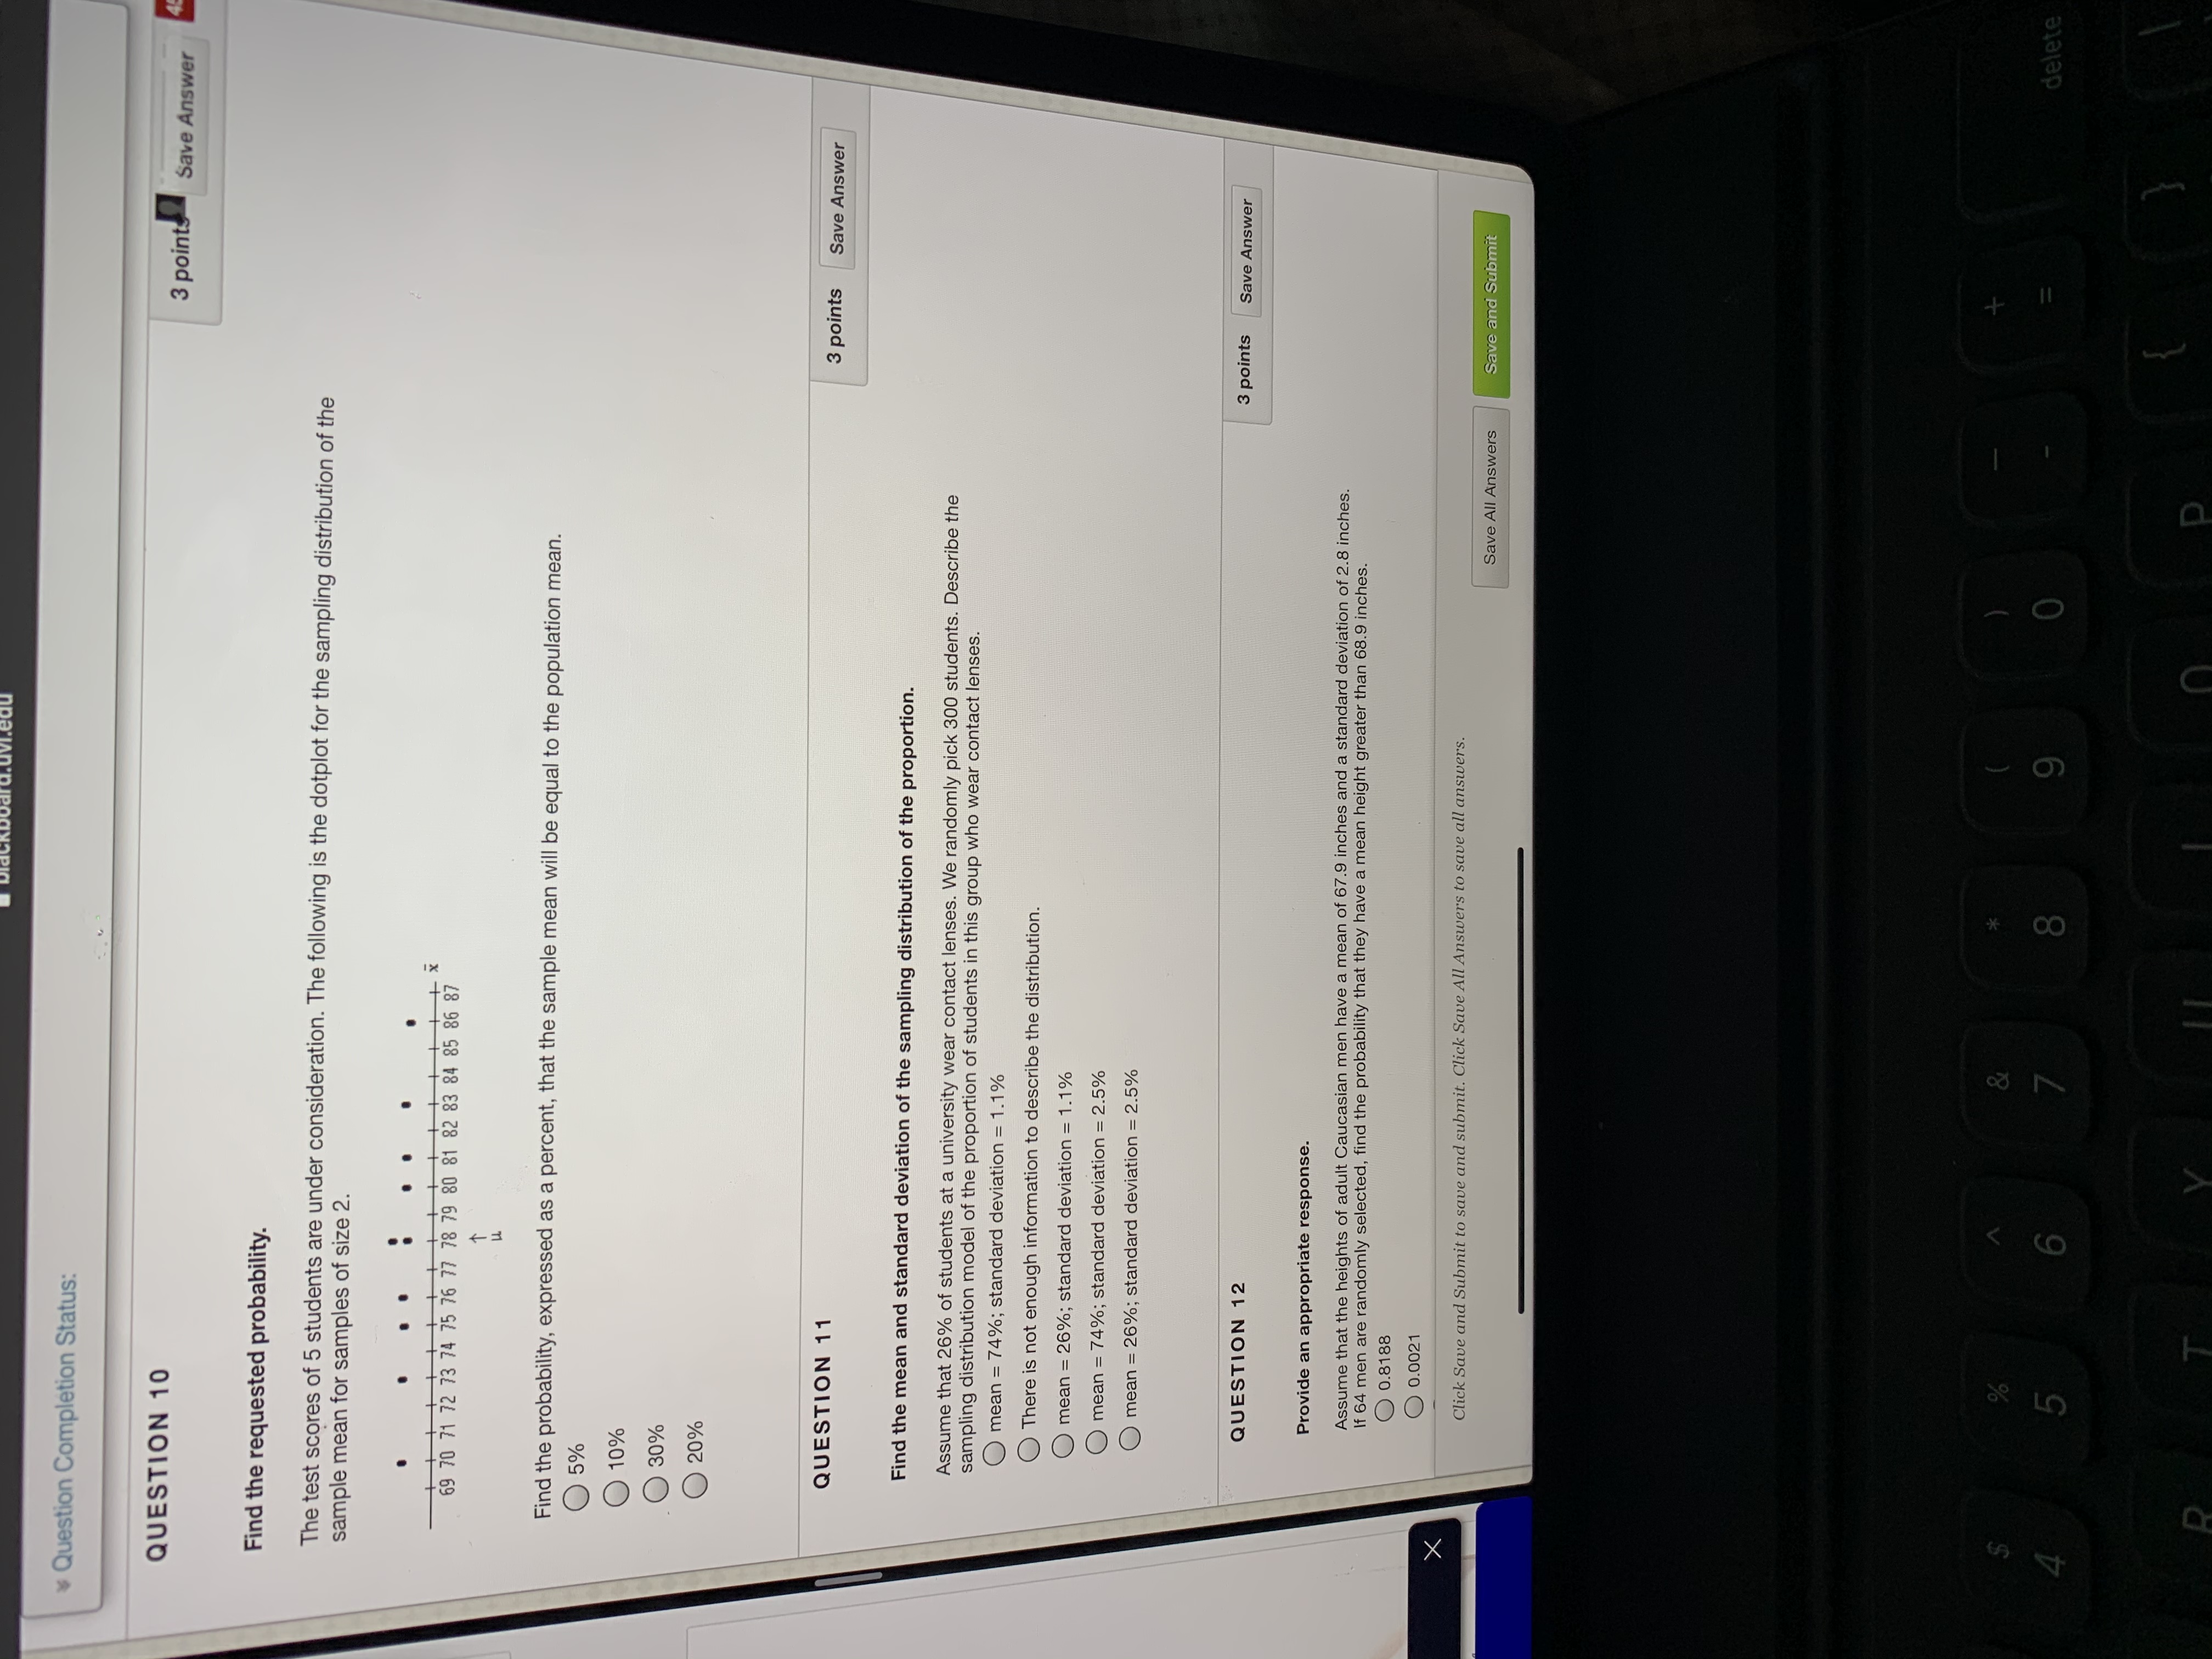
ion Completion Status: QUESTION 14 3 points Save Answ Provide an appropriate response. In one region, the September energy consumption levels for single-family homes had a mean of 1050 kWh and a standard deviation of 218 KWh. If 50 different homes are randomly selected, find the probability that their mean energy consumption level for September is greater than 1075 KWh. 0.2090 0.2910 O 0.4180 O 0.4562 0.0438 QUESTION 15 3 points Save Answer Use the given table to determine the mean, U,, of the variable x for the given sample size. Sample x 2, 3,6 3.7 2,3,7 2,6 , 7 5 3 , 6, 7 5.3 0 6 4.5 0 5 1 4 QUESTION 16 3 points Save Answer Provide an appropriate response. The sampling distribution of the sample mean is shown. If the sample size is n = 36, what is the standard deviation of the population from which the sample was drawn? Round to the nearest thousandth where appropriate. X Click Save and Submit to save and submit. Click Save All Answers to save all answers. Save All Answers Save and Submit OO O deleteuvi.edu LTE 35 Question Completion Status: QUESTION 12 3 points Save Answer Provide an appropriate response. Assume that the heights of adult Caucasian men have a mean of 67.9 inches and a standard deviation of 2.8 inches. If 64 men are randomly selected, find the probability that they have a mean height greater than 68.9 inches. 0.8188 0.0021 not enough information to determine 0.9005 0.9671 QUESTION 13 3 points Save Answer Select the most appropriate answer. A company with 520 employees conducts a poll to estimate what percentage of its employees has children under the age of 18 living at home. Out of the 50 employees randomly surveyed, 22 of them had children under the age of 18 living at home. Let X denote the random variable for which x = 1 denotes a worker with a child under the age of 18 living at home and x = 0 denote a worker who does not have a child under the age of 18 living at home. Which of the following identifies the population distribution? Assume the true percentage of employees who have a child under the age of 18 living at home is 0.55. 286 1s, 234 0s mean = 0.55, standard deviation = 0.022 22 1s, 28 0s O P(1) = 0.44, P(0) = 0.56 mean = 0.44, standard deviation = 0.07 QUESTION 14 3 points Save Answer Provide an appropriate response. In one region, the September energy consumption levels for single-family homes had a mean of 1050 KWh and a standard deviation of 218 KWh. If 50 different homes are randomly selected, find the probability that their mean energy consumption level for September is greater than 1075 kWh. 0.2090 0.2910 X O 0.4180 Click Save and Submit to save and submit. Click Save All Answers to save all answers. Save All Answers Save and Submit 6 8 O delete0.0668 0.9332 QUESTION 6 3 points Provide an appropriate response. A farmer was interest in determining how many grasshoppers were in his field. He knows that the distribution of grasshoppers may not be normally distributed in his field due to growing conditions. As he drives his tractor down each row he counts how many grasshoppers he sees flying away. After several rows he figures the mean number of flights to be 57 with a standard deviation of 12. What is the probability of the farmer will count 52 or fewer flights on average in the next 40 rows down which he drives his tractor? O 0.0410 0.0041 O 0.4959 0.9959 QUESTION 7 3 points Save Ans Provide an appropriate response. The National Association of Realtors estimates that 23% of all homes purchased in 2004 were considered investment properties. If a sample of 800 homes sold in 2004 is obtained what is the probability that between 175 and 200 homes are going to be used as investment property? 0.1335 0.7764 0.9099 0.2236 QUESTION 8 3 points Saved Find the mean and standard deviation of the sampling distribution of the proportion. A candy company claims that its jelly bean mix contains 21% blue jelly beans. Suppose that the candies are packaged at random in small bags containing about 400 jelly beans. Describe the sampling distribution model of the proportion of blue jelly beans in a bag. X mean = 21%; standard deviation = 0.8% Click Save and Submit to save and submit. Click Save All Answers to save all answers. Save All Answers Save and SubmitQuestion Completion Status: QUESTION 10 3 points Save Answer Find the requested probability. The test scores of 5 students are under consideration. The following is the dotplot for the sampling distribution of the sample mean for samples of size 2. . 69 70 71 72 73 74 75 76 77 78 79 80 81 82 83 84 85 86 87 + * Find the probability, expressed as a percent, that the sample mean will be equal to the population mean. 5% 10% 30% O 20% QUESTION 11 3 points Save Answer Find the mean and standard deviation of the sampling distribution of the proportion. Assume that 26% of students at a university wear contact lenses. We randomly pick 300 students. Describe the sampling distribution model of the proportion of students in this group who wear contact lenses. mean = 74%; standard deviation = 1.1% There is not enough information to describe the distribution. mean = 26%; standard deviation = 1.1% mean = 74%; standard deviation = 2.5% mean = 26%; standard deviation = 2.5% QUESTION 12 3 points Save Answer Provide an appropriate response. Assume that the heights of adult Caucasian men have a mean of 67.9 inches and a standard deviation of 2.8 inches. If 64 men are randomly selected, find the probability that they have a mean height greater than 68.9 inches. O 0.8188 0.0021 X Click Save and Submit to save and submit. Click Save All Answers to save all answers. Save All Answers Save and Submit 8 D 8 O O delete Pblackboard.uvi.edu I LTE 35% Question Completion Status: 4.5 0 5 0 4 45 QUESTION 16 3 points Save Answer Provide an appropriate response. The sampling distribution of the sample mean is shown. If the sample size is n = 36, what is the standard deviation of the population from which the sample was drawn? Round to the nearest thousandth where appropriate. 430 480 530 o= 1.389 O o= 8.333 1 0= 300 O o = 1800 QUESTION 17 3 points Save Answer Provide an appropriate response. Furnace repair bills are normally distributed with a mean of 266 dollars and a standard deviation of 15 dollars. If 36 of these repair bills are randomly selected, find the probability that they have a mean cost between 266 dollars and 268 dollars. O 0.2881 O 0.2119 O 0.7881 0.5517 Click Save and Submit to save and submit. Click Save All Answers to save all answers. X Save All Answers Save and Submit % 9 O delete 5 6 8
