

Answered step by step
Verified Expert Solution
Question
1 Approved Answer
can someone help me with this question? thanks 8. Drawing a yield curve Given the indicated maturities listed in the following table, assume the following
can someone help me with this question? thanks
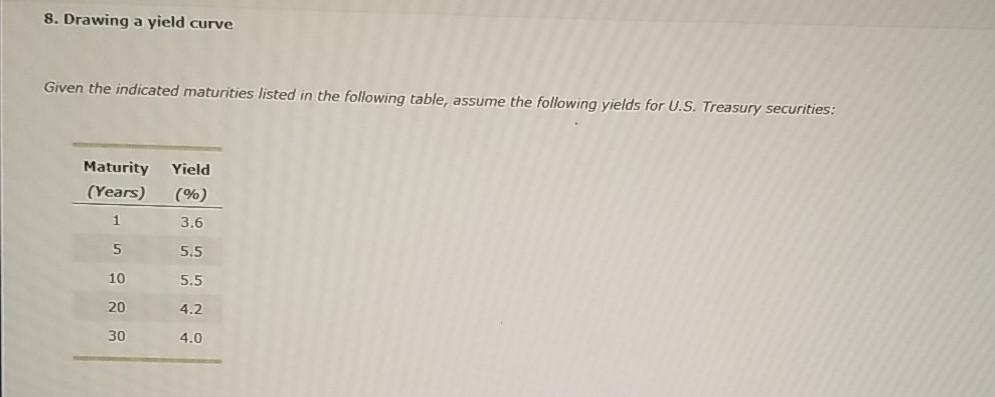
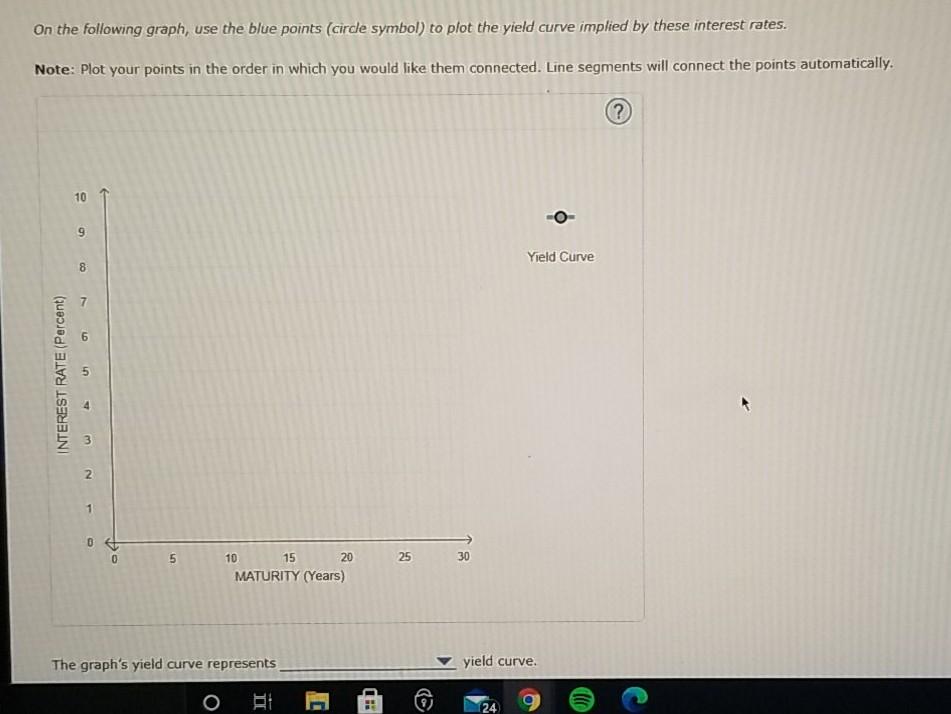
8. Drawing a yield curve Given the indicated maturities listed in the following table, assume the following yields for U.S. Treasury securities: Yield Maturity (Years) (%) 1 3.6 5 5.5 10 5.5 20 4.2 30 4.0 On the following graph, use the blue points (cirde symbol) to plot the yield curve implied by these interest rates. Note: Plot your points in the order in which you would like them connected. Line segments will connect the points automatically. ? 10 9 Yield Curve 8 7 INTEREST RATE (Percent) 5 2 1 0 0 5 10 15 25 30 20 MATURITY (Years) The graph's yield curve represents yield curve 24Step by Step Solution
There are 3 Steps involved in it
Step: 1

Get Instant Access to Expert-Tailored Solutions
See step-by-step solutions with expert insights and AI powered tools for academic success
Step: 2

Step: 3
Ace Your Homework with AI
Get the answers you need in no time with our AI-driven, step-by-step assistance
Get Started
The Investing Revolutionaries How The Worlds Greatest Investors Take On Wall Street And Win In Any Market
Authors: James N. Whiddon , Nikki Knotts
1st Edition
0071623949,0071700560