Can someone help with this project about TGT?


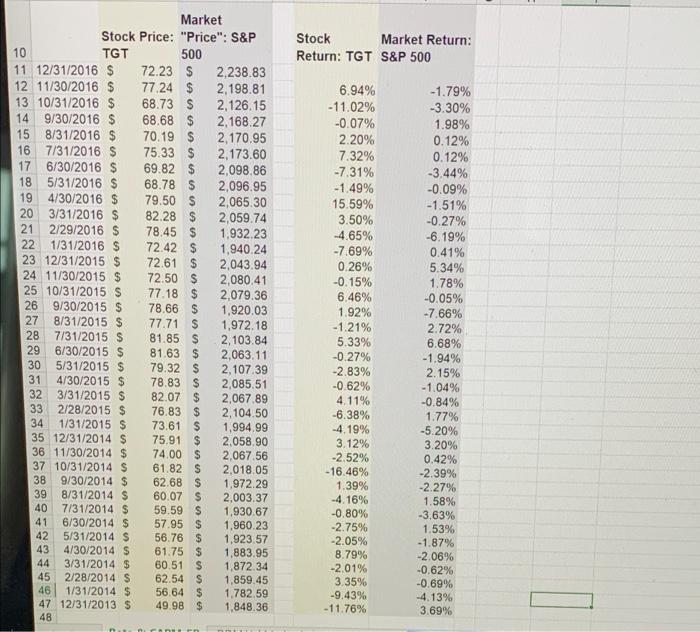
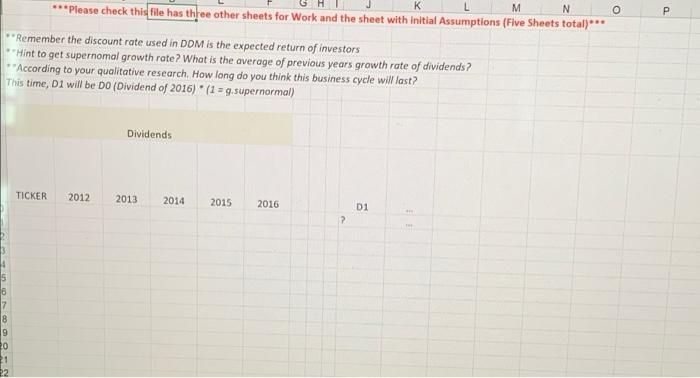
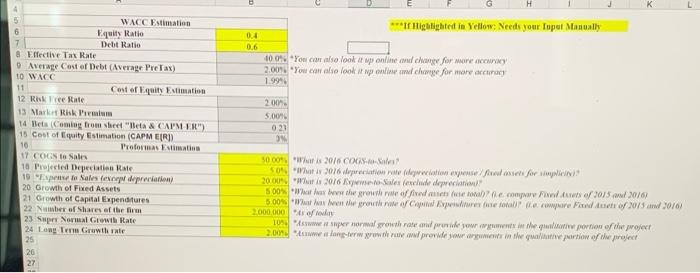
G M ***Please check this file has the other sheets for Work and the sheet with initial Assumptions Sheets total ****You can assume the Rise Freels 25 and MRP & 5% or you can calculate both parameters you wish to do so MRP Expected Rotum of De Market RinkFree Rate) (Pf you can use to Treasurydiond! 3 You can get the price data below from Yahoo Finance Covance of Stock and Yahoo France Htorical Data Market 0.000209029 You can use Excel Form COVARIANCE P Varance Frequency - Monthly 0.000898961 You can we boel om "VARP The Period December 31st, 2013 to December 2016 Stock Beta 0.232523321 beta Covariance Variance 7 Download Data CAPM ER 3% R-R+Beta" Maret Ris Pream 3 Must choose ***Ad Close of Market Stock Market Return: Return: TGT S&P 500 Market Stock Price: "Price": S&P 10 TGT 500 11 12/31/2016 $ 72.23 $ 2,238.83 12 11/30/2016 $ 77.24 $ 2,198.81 13 10/31/2016 $ 68.73 $ 2,126.15 14 9/30/2016 $ 68.68 $ 2.168.27 15 8/31/2016 $ 70.19 $ 2,170.95 16 7/31/2016 $ 75.33 $ 2,173.60 17 6/30/2016 $ 69.82 $ 2,098.86 18 5/31/2016 $ 68.78 $ 2,096.95 19 4/30/2016 $ 79.50 2,065.30 20 3/31/2016 $ 82.28 $ 2,059.74 21 2/29/2016 $ 78.45 $ 1.932.23 22 1/31/2016 $ 72.42 $ 1,940.24 23 12/31/2015 $ 72.61 $ 2,043.94 24 11/30/2015 $ 72.50 $ 2,080,41 25 10/31/2015 S 77.18 $ 2,079.36 26 9/30/2015 $ 78.66 $ 1,920.03 27 8/31/2015 $ 77.71 $ 1,972.18 28 7/31/2015 S 81.85 $ 2,103.84 29 6/30/2015 S 81.63 $ 2,063.11 30 5/31/2015 $ 79.32 $ 2,107.39 31 4/30/2015 $ 78.83 $ 2,085.51 32 3/31/2015 $ 82.07 $ 2,067.89 33 2/28/2015 $ 76.83 $ 2,104.50 34 1/31/2015 $ 73.61 S 1,994.99 35 12/31/2014 $ 75.91 $ 2,058.90 36 11/30/2014 $ 74.00 $ 2.067.56 37 10/31/2014 S 61.82 $ 2,018.05 38 9/30/2014 $ 62.68 $ 1.972.29 39 8/31/2014 $ 60.07 $ 2.003.37 40 7/31/2014 $ 59.59 $ 1.930.67 41 6/30/2014 S 57.95 $ 1.960.23 42 5/31/2014 $ 56.76 $ 1,923.57 43 4/30/2014 S 61.75 $ 1,883.95 44 3/31/2014 $ 60.51 $ 1,872.34 45 2/28/2014 S 62.54 $ 1,859.45 46 1/31/2014 $ 56.64 $ 1,782.59 47 12/31/2013 $ 49.98 $ 1,848.36 48 6.94% -11.02% -0.07% 2.20% 7.32% -7.31% -1.49% 15.59% 3.50% -4.65% -7.69% 0.26% -0.15% 6.46% 1.92% -1.21% 5.33% -0.27% -2.83% -0.62% 4.11% -6.38% -4.19% 3.12% -2.52% -16.46% 1.39% -4.16% -0.80% -2.75% -2.05% 8.79% -2.01% 3.35% -9.43% -11.76% -1.79% -3.30% 1.98% 0.12% 0.12% -3.44% -0.09% -1.51% -0.27% -6.19% 0.41% 5.34% 1.78% -0.05% -7.66% 2.72% 6.68% -1.94% 2.15% -1.04% -0.84% 1.77% -5.20% 3.20% 0.42% -2.39% -2.27% 1.58% -3.63% 1.53% -1.87% -2.06% -0.62% -0.69% -4.13% 3.69% K L O P P M N ***Please check this file has three other sheets for Work and the sheet with initial Assumptions (Five Sheets total)*** **Remember the discount rate used in DDM is the expected return of investors "Hint to get supernomal growth rate? What is the average of previous years growth rate of dividends? **According to your qualitative research. How long do you think this business cycle will last? This time, D1 will be Do (Dividend of 2016) * (1 = 9.supernormal) Dividends TICKER 2012 2013 2014 2015 2016 D1 F ? 22 T H NO F hehehether for the theme Shots You can this from your DCFINORAT Interest for 2017 who owe EPS016.at ve must continue Abona TICE You 2014 2015 2010 TICKER 2013 2011 2012 2014 2015 K **** Highlighted to Yellow Needs your Topal Mosually 0.4 0.6 100% "You can also look at some change for more 2.0048.You can also look it in charge for more 1.9994 4 5 WACC Estimation 6 Equity Ratio 7 Debt Ratio & Effective Tax Rate Average Cost of Debt (Average PreTax) 10 WAC 11 Cost of quity Estimation 12 Rare Rate 13 Market Rik Pemium 14 Beta (Coming from sheet "Beta & CAPM ER") 15 Cost of Equity Estimation (CAPM EIRI) 16 Proformas Estimation 17 COGN to San 16 Perid Depreciation Rate 19 El Sales fengulation) 20 Growth of Fixed Assets 21 Growth of Capital Expenditures 22 Number of shares of the film 23 Sep Normal Growth Rate 24 Long Term Growth rate 25 26 27 200 5.00 023 ON 5000W 2016 COC 50 x 2076 relation with for 20.001 W2076 Sales (exelile prin 5009 Warfare the growth fived econor Find wis /2015 20/61 5.00 Whave growthw Calw Expediente de care de 2015 al 30/0) 2.000.000 109 www.super normal growth rate and provide you rement in the profile projet 2.00 www long-term grow wprowwe sou verwawi wahe partow of the feet G M ***Please check this file has the other sheets for Work and the sheet with initial Assumptions Sheets total ****You can assume the Rise Freels 25 and MRP & 5% or you can calculate both parameters you wish to do so MRP Expected Rotum of De Market RinkFree Rate) (Pf you can use to Treasurydiond! 3 You can get the price data below from Yahoo Finance Covance of Stock and Yahoo France Htorical Data Market 0.000209029 You can use Excel Form COVARIANCE P Varance Frequency - Monthly 0.000898961 You can we boel om "VARP The Period December 31st, 2013 to December 2016 Stock Beta 0.232523321 beta Covariance Variance 7 Download Data CAPM ER 3% R-R+Beta" Maret Ris Pream 3 Must choose ***Ad Close of Market Stock Market Return: Return: TGT S&P 500 Market Stock Price: "Price": S&P 10 TGT 500 11 12/31/2016 $ 72.23 $ 2,238.83 12 11/30/2016 $ 77.24 $ 2,198.81 13 10/31/2016 $ 68.73 $ 2,126.15 14 9/30/2016 $ 68.68 $ 2.168.27 15 8/31/2016 $ 70.19 $ 2,170.95 16 7/31/2016 $ 75.33 $ 2,173.60 17 6/30/2016 $ 69.82 $ 2,098.86 18 5/31/2016 $ 68.78 $ 2,096.95 19 4/30/2016 $ 79.50 2,065.30 20 3/31/2016 $ 82.28 $ 2,059.74 21 2/29/2016 $ 78.45 $ 1.932.23 22 1/31/2016 $ 72.42 $ 1,940.24 23 12/31/2015 $ 72.61 $ 2,043.94 24 11/30/2015 $ 72.50 $ 2,080,41 25 10/31/2015 S 77.18 $ 2,079.36 26 9/30/2015 $ 78.66 $ 1,920.03 27 8/31/2015 $ 77.71 $ 1,972.18 28 7/31/2015 S 81.85 $ 2,103.84 29 6/30/2015 S 81.63 $ 2,063.11 30 5/31/2015 $ 79.32 $ 2,107.39 31 4/30/2015 $ 78.83 $ 2,085.51 32 3/31/2015 $ 82.07 $ 2,067.89 33 2/28/2015 $ 76.83 $ 2,104.50 34 1/31/2015 $ 73.61 S 1,994.99 35 12/31/2014 $ 75.91 $ 2,058.90 36 11/30/2014 $ 74.00 $ 2.067.56 37 10/31/2014 S 61.82 $ 2,018.05 38 9/30/2014 $ 62.68 $ 1.972.29 39 8/31/2014 $ 60.07 $ 2.003.37 40 7/31/2014 $ 59.59 $ 1.930.67 41 6/30/2014 S 57.95 $ 1.960.23 42 5/31/2014 $ 56.76 $ 1,923.57 43 4/30/2014 S 61.75 $ 1,883.95 44 3/31/2014 $ 60.51 $ 1,872.34 45 2/28/2014 S 62.54 $ 1,859.45 46 1/31/2014 $ 56.64 $ 1,782.59 47 12/31/2013 $ 49.98 $ 1,848.36 48 6.94% -11.02% -0.07% 2.20% 7.32% -7.31% -1.49% 15.59% 3.50% -4.65% -7.69% 0.26% -0.15% 6.46% 1.92% -1.21% 5.33% -0.27% -2.83% -0.62% 4.11% -6.38% -4.19% 3.12% -2.52% -16.46% 1.39% -4.16% -0.80% -2.75% -2.05% 8.79% -2.01% 3.35% -9.43% -11.76% -1.79% -3.30% 1.98% 0.12% 0.12% -3.44% -0.09% -1.51% -0.27% -6.19% 0.41% 5.34% 1.78% -0.05% -7.66% 2.72% 6.68% -1.94% 2.15% -1.04% -0.84% 1.77% -5.20% 3.20% 0.42% -2.39% -2.27% 1.58% -3.63% 1.53% -1.87% -2.06% -0.62% -0.69% -4.13% 3.69% K L O P P M N ***Please check this file has three other sheets for Work and the sheet with initial Assumptions (Five Sheets total)*** **Remember the discount rate used in DDM is the expected return of investors "Hint to get supernomal growth rate? What is the average of previous years growth rate of dividends? **According to your qualitative research. How long do you think this business cycle will last? This time, D1 will be Do (Dividend of 2016) * (1 = 9.supernormal) Dividends TICKER 2012 2013 2014 2015 2016 D1 F ? 22 T H NO F hehehether for the theme Shots You can this from your DCFINORAT Interest for 2017 who owe EPS016.at ve must continue Abona TICE You 2014 2015 2010 TICKER 2013 2011 2012 2014 2015 K **** Highlighted to Yellow Needs your Topal Mosually 0.4 0.6 100% "You can also look at some change for more 2.0048.You can also look it in charge for more 1.9994 4 5 WACC Estimation 6 Equity Ratio 7 Debt Ratio & Effective Tax Rate Average Cost of Debt (Average PreTax) 10 WAC 11 Cost of quity Estimation 12 Rare Rate 13 Market Rik Pemium 14 Beta (Coming from sheet "Beta & CAPM ER") 15 Cost of Equity Estimation (CAPM EIRI) 16 Proformas Estimation 17 COGN to San 16 Perid Depreciation Rate 19 El Sales fengulation) 20 Growth of Fixed Assets 21 Growth of Capital Expenditures 22 Number of shares of the film 23 Sep Normal Growth Rate 24 Long Term Growth rate 25 26 27 200 5.00 023 ON 5000W 2016 COC 50 x 2076 relation with for 20.001 W2076 Sales (exelile prin 5009 Warfare the growth fived econor Find wis /2015 20/61 5.00 Whave growthw Calw Expediente de care de 2015 al 30/0) 2.000.000 109 www.super normal growth rate and provide you rement in the profile projet 2.00 www long-term grow wprowwe sou verwawi wahe partow of the feet


