

Question: Can someone please help me with this problem. How do you solve? Below is a correlation matrix from SAS (Statistical Analysis System) for three variables:
Can someone please help me with this problem. How do you solve?
Below is a correlation matrix from SAS (Statistical Analysis System) for three variables: (a) Age, (b) Systolic Blood Pressure (SBP), and Diastolic Blood Pressure (DBP).
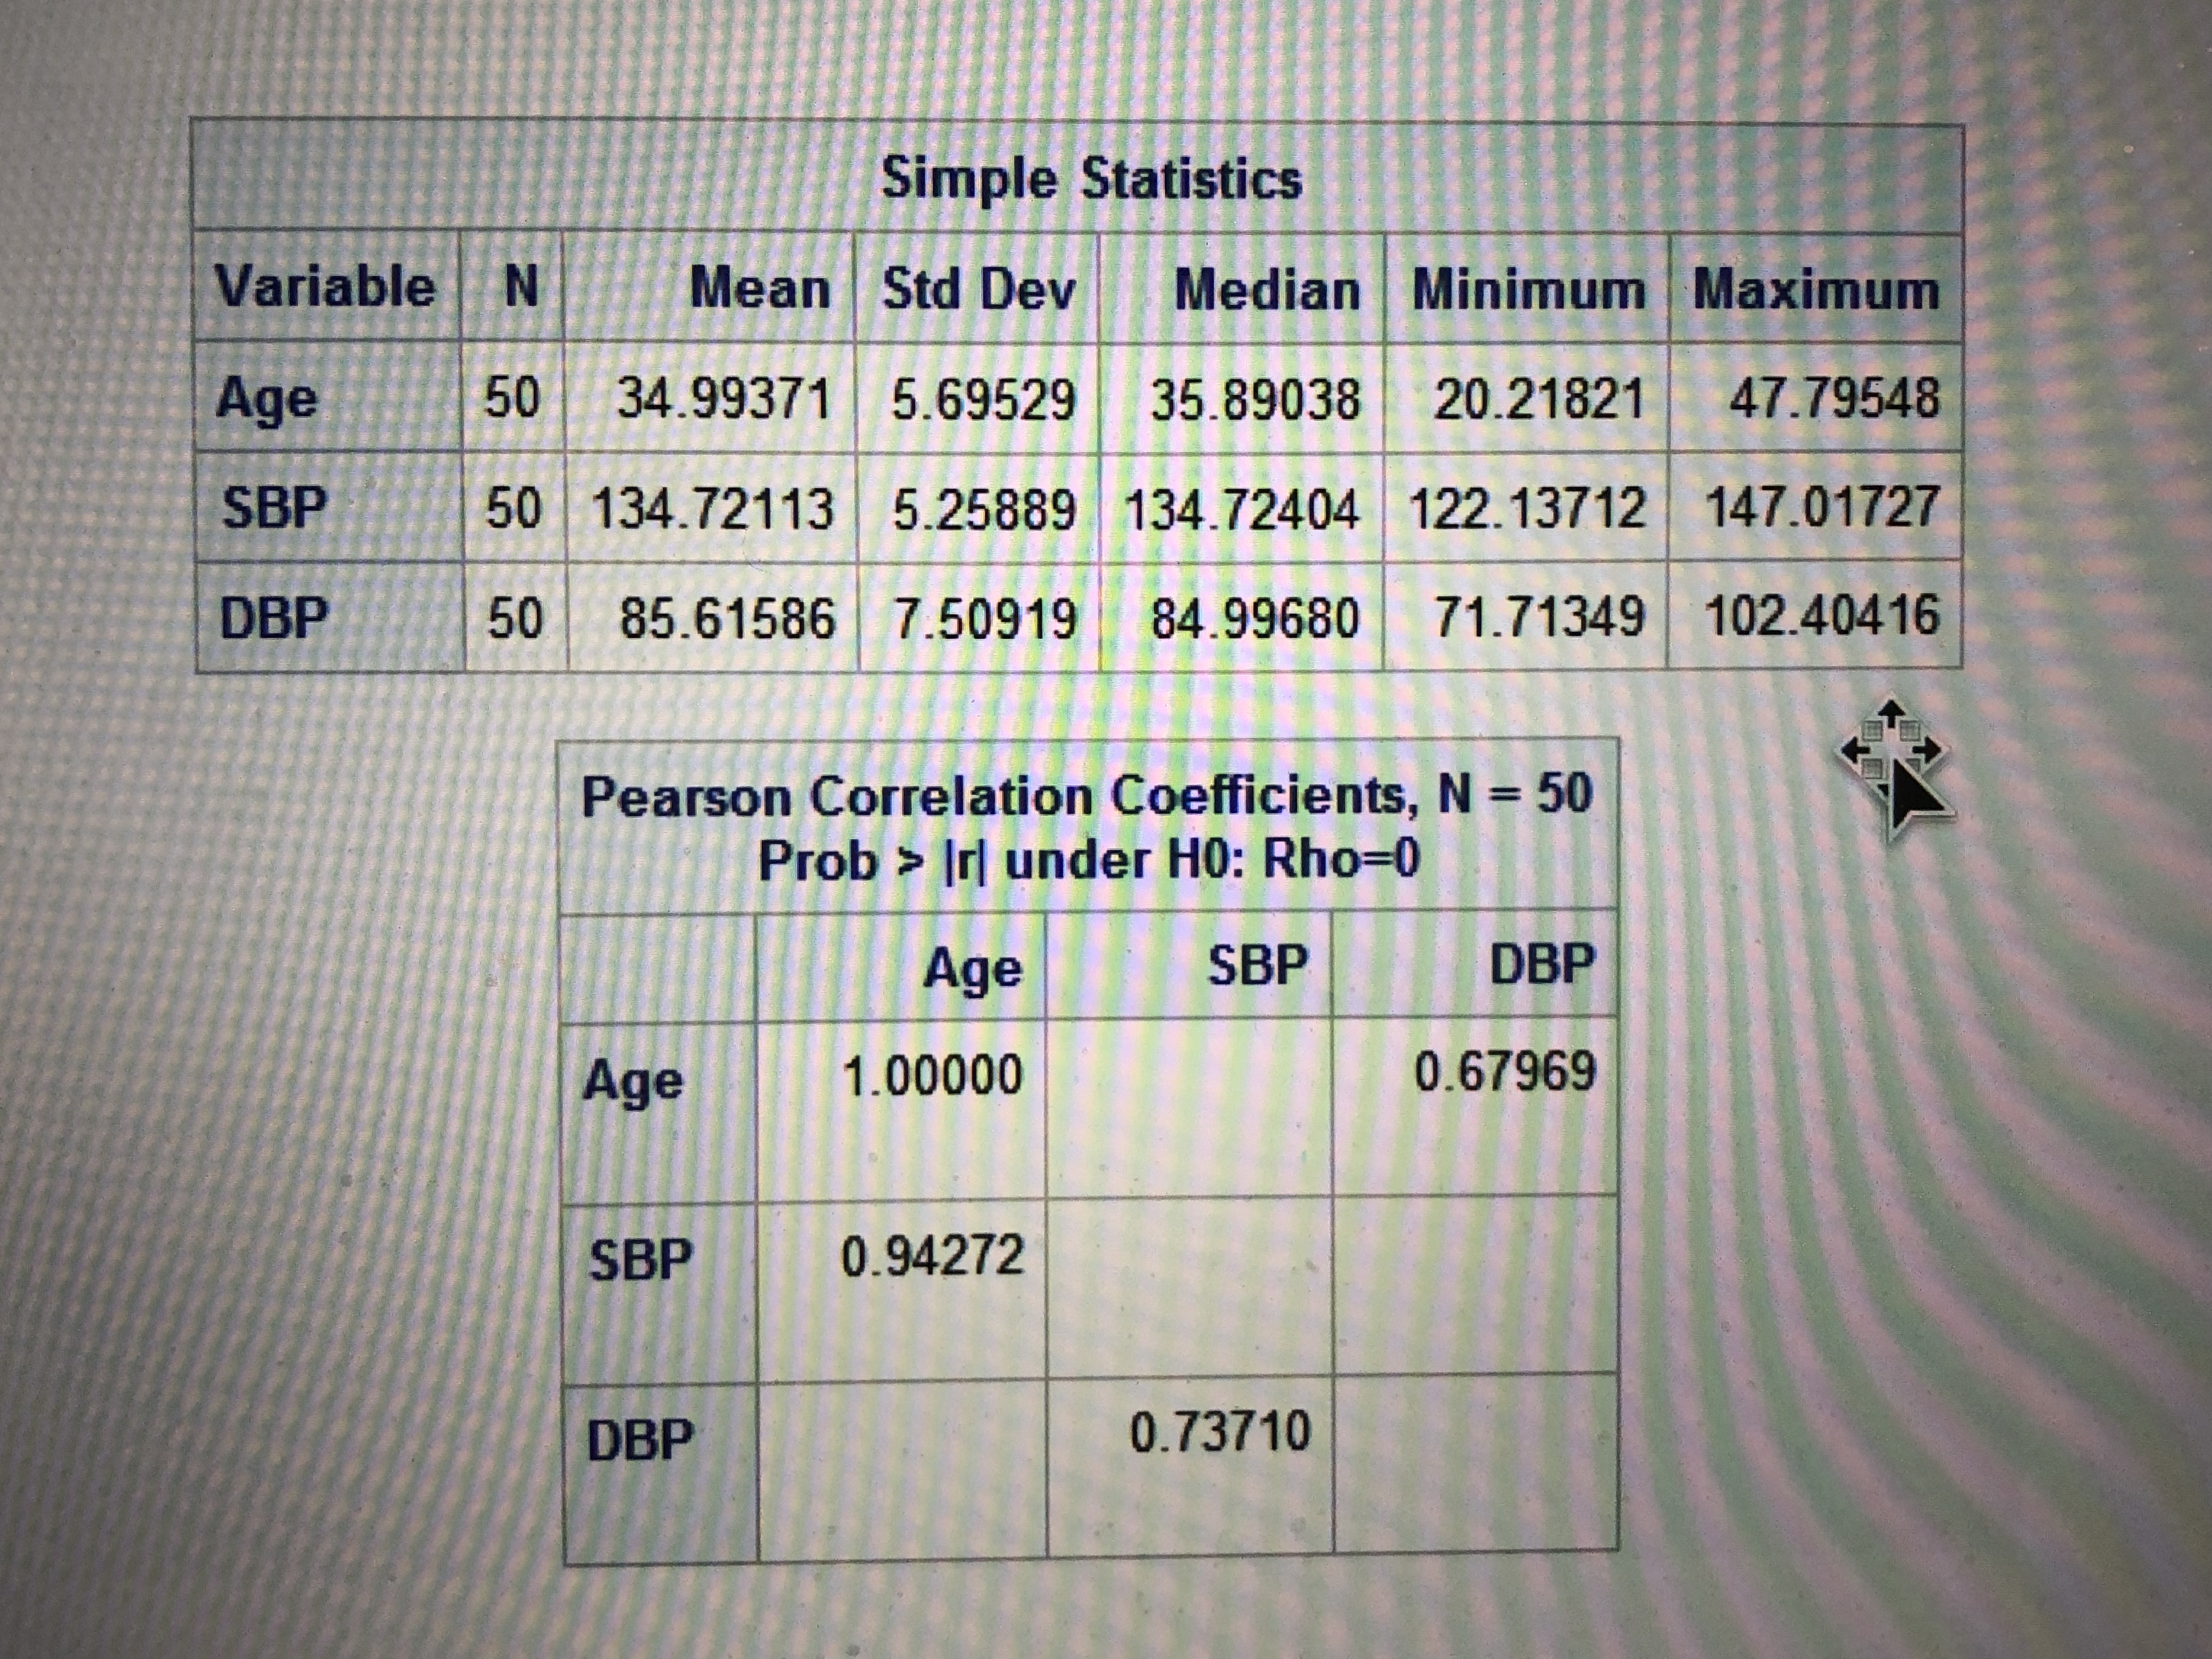
Simple Statistics Variable N Mean Std Dev Median Minimum Maximum Age 50 34.99371 5.69529 35.89038 20.21821 47.79548 SBP 50 134.72113 5.25889 134.72404 122. 13712 147.01727 DBP 50 85.61586 7.50919 84.99680 71.71349 102.40416 Pearson Correlation Coefficients, N = 50 Prob > [r| under HO: Rho=0 Age SBP DBP Age 1.00000 0.67969 SBP 0.94272 DBP 0.73710
Step by Step Solution
There are 3 Steps involved in it
1 Expert Approved Answer
Step: 1 Unlock

Question Has Been Solved by an Expert!
Get step-by-step solutions from verified subject matter experts
Step: 2 Unlock
Step: 3 Unlock