

Question: Can someone please help me with this question? Problem 3. In computer vision we are always interested in finding the change of intensity values, usually
Can someone please help me with this question?
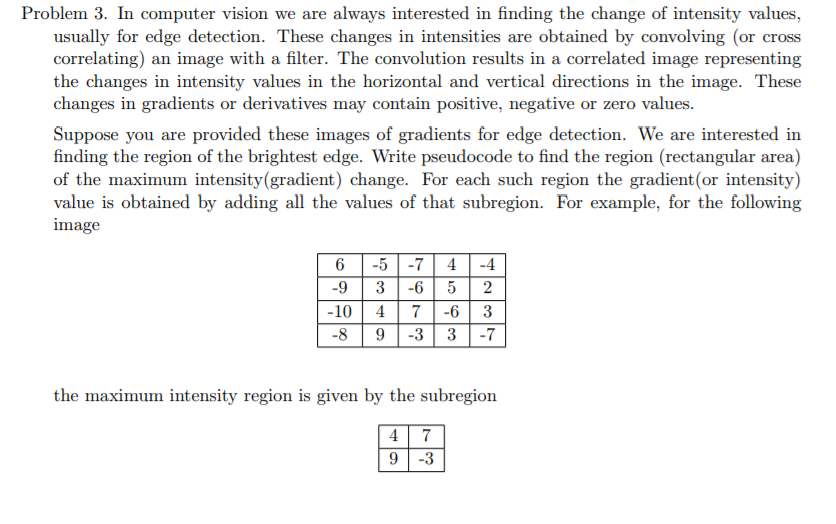
Problem 3. In computer vision we are always interested in finding the change of intensity values, usually for edge detection. These changes in intensities are obtained by convolving (or cross correlating) an image with a filter. The convolution results in a correlated image representing the changes in intensity values in the horizontal and vertical directions in the image. These changes in gradients or derivatives may contain positive, negative or zero values. Suppose you are provided these images of gradients for edge detection. We are interested in finding the region of the brightest edge. Write pseudocode to find the region (rectangular area) of the maximum intensity(gradient) change. For each such region the gradient (or intensity) value is obtained by adding all the values of that subregion. For example, for the following image 6 -5-7 4-4 9 3-6 52 -8 9 -3 3-7 the maximum intensity region is given by the subregion -10 4 7 -63 93 Problem 3. In computer vision we are always interested in finding the change of intensity values, usually for edge detection. These changes in intensities are obtained by convolving (or cross correlating) an image with a filter. The convolution results in a correlated image representing the changes in intensity values in the horizontal and vertical directions in the image. These changes in gradients or derivatives may contain positive, negative or zero values. Suppose you are provided these images of gradients for edge detection. We are interested in finding the region of the brightest edge. Write pseudocode to find the region (rectangular area) of the maximum intensity(gradient) change. For each such region the gradient (or intensity) value is obtained by adding all the values of that subregion. For example, for the following image 6 -5-7 4-4 9 3-6 52 -8 9 -3 3-7 the maximum intensity region is given by the subregion -10 4 7 -63 93
Step by Step Solution
There are 3 Steps involved in it

Get step-by-step solutions from verified subject matter experts