

Answered step by step
Verified Expert Solution
Question
1 Approved Answer
Can someone please help me write an analysis of each of these statements. thank you Financial Analysis (With each section below, write an analysis of
Can someone please help me write an analysis of each of these statements. thank you
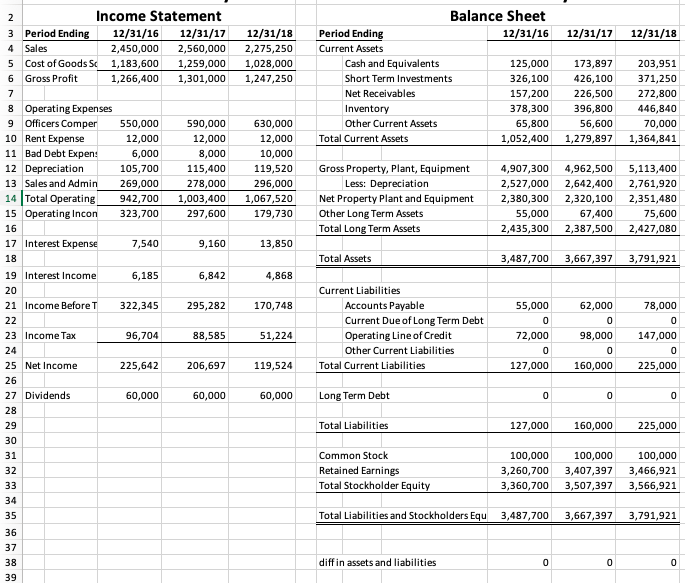
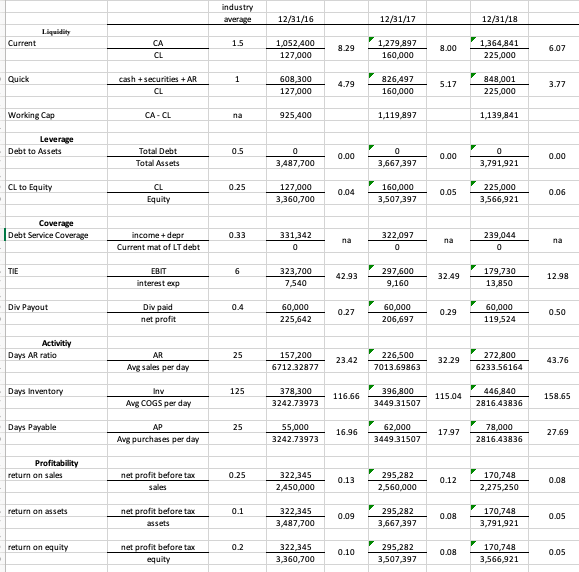
Financial Analysis (With each section below, write an analysis of the statement Income Statement Balance Sheet Ratio Analysis 12/31/17 12/31/18 12/31/18 2,275,250 1,028,000 1,247,250 Balance Sheet Period Ending 12/31/16 Current Assets Cash and Equivalents 125,000 Short Term Investments 326,100 Net Receivables 157,200 Inventory 378,300 Other Current Assets 65,800 Total Current Assets 1,052,400 173,897 426,100 226,500 396,800 56,600 1,279,897 203,951 371,250 272,800 446,840 70,000 1,364,841 630,000 12,000 10,000 119,520 296,000 1,067,520 179,730 Gross Property, Plant, Equipment Less: Depreciation Net Property Plant and Equipment Other Long Term Assets Total Long Term Assets 4,907,300 2,527,000 2,380,300 55,000 2,435,300 4,962,500 2,642,400 2,320,100 67,400 2,387,500 5,113,400 2,761,920 2,351,480 75,600 2,427,080 13,850 Total Assets 3,487,700 3,667,397 3,791,921 4,868 2 Income Statement 3 Period Ending 12/31/16 12/31/17 4 Sales 2,450,000 2,560,000 5 Cost of Goods Sc 1,183,600 1,259,000 6 Gross Profit 1,266,400 1,301,000 7 8 Operating Expenses 9 Officers Comper 550,000 590,000 10 Rent Expense 12,000 12,000 11 Bad Debt Expen: 6,000 8,000 12 Depreciation 105,700 115,400 13 Sales and Admin 269,000 278,000 14 Total Operating 942,700 1,003,400 15 Operating Incon 323,700 297,600 16 17 Interest Expense 7,540 9,160 18 19 Interest Income 6,185 6,842 20 21 Income Before T 322,345 295,282 22 23 Income Tax 96,704 88,585 24 25 Net Income 225,642 206,697 26 27 Dividends 60,000 60,000 28 29 30 31 32 33 34 35 36 37 38 39 170,748 Current Liabilities Accounts Payable Current Due of Long Term Debt Operating Line of Credit Other Current Liabilities Total Current Liabilities 51,224 55,000 0 72,000 0 127,000 62,000 0 98,000 0 160,000 78,000 0 147,000 0 225,000 119,524 60,000 Long Term Debt 0 0 0 Total Liabilities 127,000 160,000 225,000 Common Stock Retained Earnings Total Stockholder Equity 100,000 3,260,700 3,360,700 100,000 3,407,397 3,507,397 100,000 3,466,921 3,566,921 Total Liabilities and Stockholders Equ 3,487,700 3,667,397 3,791,921 diff in assets and liabilities 0 0 0 industry average 12/31/16 12/31/17 12/31/18 Liquidity Current 15 CA CL 1,052,400 127,000 8.29 1,279,897 160,000 8.00 1,364,841 225,000 6.07 Quick 1 cash + securities + AR CL 608,300 127,000 4.79 826,497 160,000 5.17 848,001 225,000 3.77 Working Cap CA-CL na 925,400 1,119,897 1,139,841 Leverage Debt to Assets 0.5 Total Debt Total Assets 0 3,487,700 0.00 0 3,667,397 0.00 0 3,791,921 0.00 CL to Equity 0.25 CL Equity 127,000 3,360,700 0.04 160,000 3,507,397 0.05 225.000 3,566,921 0.06 Coverage Debt Service Coverage 0.33 income + depr Current mat of LT debt 331,342 0 na 322,097 0 na 239,044 0 na TIE 6 EBIT interest exp 323,700 7.540 42.93 297,600 9,160 32.49 179,730 13,850 12.98 Div Payout 0.4 Div paid net profit 60,000 225,642 0.27 60,000 206,697 0.29 60,000 119,524 0.50 Activity Days AR ratio 25 AR Ang sales per day 157 200 6712.32877 23.42 226,500 7013.69863 32.29 272,800 6233.56164 43.76 Days Inventory 125 Inv Avg COGS per day 378,300 3242.73973 116.66 396 800 3449.31507 115.04 446 840 2816.43836 158.65 Days Payable 25 AP Avg purchases per day 55,000 3242.73973 16.96 62,000 3449.31507 17.97 78,000 2816.43836 27.69 Profitability return on sales 0.25 net profit before tax sales 322,345 2,450,000 0.13 295,282 2,560,000 0.12 170,748 2,275,250 0.08 return on assets 0.1 net profit before tax assets 322,345 3,487,700 0.09 295,282 3,667,397 0.08 170,748 3,791,921 0.05 return on equity 0.2 net profit before tax equity 322,345 3,360,700 0.10 295,282 3,507,397 0.08 170,748 3,566,921 0.05 Financial Analysis (With each section below, write an analysis of the statement Income Statement Balance Sheet Ratio Analysis 12/31/17 12/31/18 12/31/18 2,275,250 1,028,000 1,247,250 Balance Sheet Period Ending 12/31/16 Current Assets Cash and Equivalents 125,000 Short Term Investments 326,100 Net Receivables 157,200 Inventory 378,300 Other Current Assets 65,800 Total Current Assets 1,052,400 173,897 426,100 226,500 396,800 56,600 1,279,897 203,951 371,250 272,800 446,840 70,000 1,364,841 630,000 12,000 10,000 119,520 296,000 1,067,520 179,730 Gross Property, Plant, Equipment Less: Depreciation Net Property Plant and Equipment Other Long Term Assets Total Long Term Assets 4,907,300 2,527,000 2,380,300 55,000 2,435,300 4,962,500 2,642,400 2,320,100 67,400 2,387,500 5,113,400 2,761,920 2,351,480 75,600 2,427,080 13,850 Total Assets 3,487,700 3,667,397 3,791,921 4,868 2 Income Statement 3 Period Ending 12/31/16 12/31/17 4 Sales 2,450,000 2,560,000 5 Cost of Goods Sc 1,183,600 1,259,000 6 Gross Profit 1,266,400 1,301,000 7 8 Operating Expenses 9 Officers Comper 550,000 590,000 10 Rent Expense 12,000 12,000 11 Bad Debt Expen: 6,000 8,000 12 Depreciation 105,700 115,400 13 Sales and Admin 269,000 278,000 14 Total Operating 942,700 1,003,400 15 Operating Incon 323,700 297,600 16 17 Interest Expense 7,540 9,160 18 19 Interest Income 6,185 6,842 20 21 Income Before T 322,345 295,282 22 23 Income Tax 96,704 88,585 24 25 Net Income 225,642 206,697 26 27 Dividends 60,000 60,000 28 29 30 31 32 33 34 35 36 37 38 39 170,748 Current Liabilities Accounts Payable Current Due of Long Term Debt Operating Line of Credit Other Current Liabilities Total Current Liabilities 51,224 55,000 0 72,000 0 127,000 62,000 0 98,000 0 160,000 78,000 0 147,000 0 225,000 119,524 60,000 Long Term Debt 0 0 0 Total Liabilities 127,000 160,000 225,000 Common Stock Retained Earnings Total Stockholder Equity 100,000 3,260,700 3,360,700 100,000 3,407,397 3,507,397 100,000 3,466,921 3,566,921 Total Liabilities and Stockholders Equ 3,487,700 3,667,397 3,791,921 diff in assets and liabilities 0 0 0 industry average 12/31/16 12/31/17 12/31/18 Liquidity Current 15 CA CL 1,052,400 127,000 8.29 1,279,897 160,000 8.00 1,364,841 225,000 6.07 Quick 1 cash + securities + AR CL 608,300 127,000 4.79 826,497 160,000 5.17 848,001 225,000 3.77 Working Cap CA-CL na 925,400 1,119,897 1,139,841 Leverage Debt to Assets 0.5 Total Debt Total Assets 0 3,487,700 0.00 0 3,667,397 0.00 0 3,791,921 0.00 CL to Equity 0.25 CL Equity 127,000 3,360,700 0.04 160,000 3,507,397 0.05 225.000 3,566,921 0.06 Coverage Debt Service Coverage 0.33 income + depr Current mat of LT debt 331,342 0 na 322,097 0 na 239,044 0 na TIE 6 EBIT interest exp 323,700 7.540 42.93 297,600 9,160 32.49 179,730 13,850 12.98 Div Payout 0.4 Div paid net profit 60,000 225,642 0.27 60,000 206,697 0.29 60,000 119,524 0.50 Activity Days AR ratio 25 AR Ang sales per day 157 200 6712.32877 23.42 226,500 7013.69863 32.29 272,800 6233.56164 43.76 Days Inventory 125 Inv Avg COGS per day 378,300 3242.73973 116.66 396 800 3449.31507 115.04 446 840 2816.43836 158.65 Days Payable 25 AP Avg purchases per day 55,000 3242.73973 16.96 62,000 3449.31507 17.97 78,000 2816.43836 27.69 Profitability return on sales 0.25 net profit before tax sales 322,345 2,450,000 0.13 295,282 2,560,000 0.12 170,748 2,275,250 0.08 return on assets 0.1 net profit before tax assets 322,345 3,487,700 0.09 295,282 3,667,397 0.08 170,748 3,791,921 0.05 return on equity 0.2 net profit before tax equity 322,345 3,360,700 0.10 295,282 3,507,397 0.08 170,748 3,566,921 0.05Step by Step Solution
There are 3 Steps involved in it
Step: 1

Get Instant Access to Expert-Tailored Solutions
See step-by-step solutions with expert insights and AI powered tools for academic success
Step: 2

Step: 3
Ace Your Homework with AI
Get the answers you need in no time with our AI-driven, step-by-step assistance
Get Started
Understanding ETF Options Profitable Strategies For Diversified Low Risk Investing
Authors: Kenneth R. Trester
1st Edition
007176030X, 0071760431, 9780071760430