

Question
Can someone please write R code for PART C and D? Thanks so much. HERE IS A LINK TO WHERE THE prostate.Rdata can be downloaded:
 Can someone please write R code for "PART C and D"? Thanks so much.
HERE IS A LINK TO WHERE THE prostate.Rdata can be downloaded:
https://github.com/cran/spls/blob/master/data/prostate.RData
In addition, I should also mention that I have already created a vector which has one entry for each row of the prostate cancer data, and where yi = lpsa_i. Moreover, I created a matrix called X which contains the 6 cell clinical measure-ments for each row in in the dataset (all columns except the "lpsa" column). In class we added a column of ones to X to account for the intercept, but in the assignment he said not to bother with this since he pre-subtracted a constant from lpca so that the intercept will be zero.
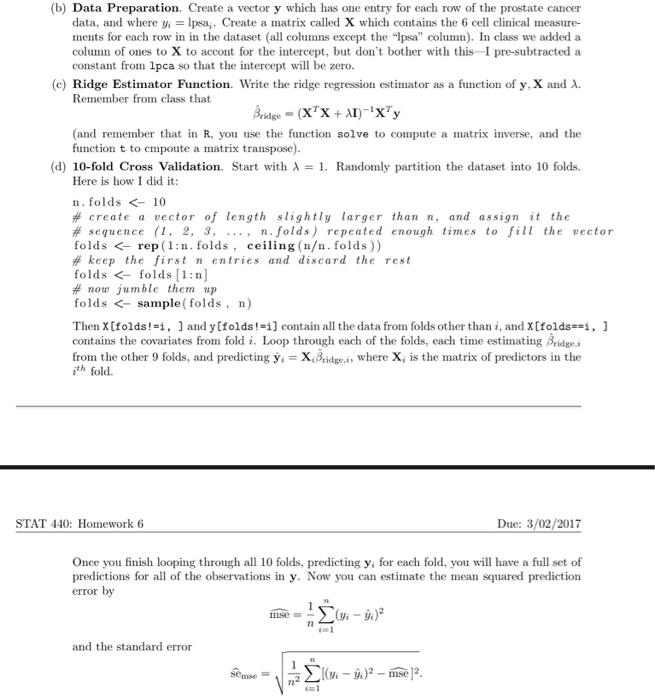
(b) Data Preparation Create a vector y which has one entry for each row of the prostate cancer data, and where yi lpsai. Create a matrix called X hich contains the 6 cell clinical measure- ments for each row in in the dataset (all columns except the "lpsa" column). In class we added a column of ones to X to accont for the intercept, but don't bother with this I pre-subtracted a constant from lpca so that the intercept will be zero. (c) Ridge Estimator Function. Write the ridge regression estimator as a function of y,x and A. Remember from class that idge (and remember that in R, you use the function solve to compute a matrix inverse, and the function t to cmpoute a matrix transpose). (d) 10-fold Cross Validation. Start with A 1. Randomly partition the dataset into 10 folds. Here is how I did it n folds K- 10 create a vector of length slightly larger than n and assign it the sequence (1, 2, 3, n. folds) repeated enough times to fill the vector folds rep (1:n. folds ceiling (n. folds keep the first n entries and discard the rest folds folds (1:n] now jumble them up folds sample folds, Then x[folds! i, J and y[folds i] contain all the data from folds other than i, and xCfolds i, J contains the covariates from fold i. Loop through each of the folds, each time estimating Bridge i from the other 9 folds, and predicting y Bridge, i, where Xi is the matrix of predictors in the ith fold. Due: 3/02/2017 STAT 440: Homework 6 Once you finish looping through all 10 folds, predicting y, for each fold, you will have a full set of predictions for all of the observations in y. Now you can estimate the mean squared prediction error by i 1 and the standard error mse (b) Data Preparation Create a vector y which has one entry for each row of the prostate cancer data, and where yi lpsai. Create a matrix called X hich contains the 6 cell clinical measure- ments for each row in in the dataset (all columns except the "lpsa" column). In class we added a column of ones to X to accont for the intercept, but don't bother with this I pre-subtracted a constant from lpca so that the intercept will be zero. (c) Ridge Estimator Function. Write the ridge regression estimator as a function of y,x and A. Remember from class that idge (and remember that in R, you use the function solve to compute a matrix inverse, and the function t to cmpoute a matrix transpose). (d) 10-fold Cross Validation. Start with A 1. Randomly partition the dataset into 10 folds. Here is how I did it n folds K- 10 create a vector of length slightly larger than n and assign it the sequence (1, 2, 3, n. folds) repeated enough times to fill the vector folds rep (1:n. folds ceiling (n. folds keep the first n entries and discard the rest folds folds (1:n] now jumble them up folds sample folds, Then x[folds! i, J and y[folds i] contain all the data from folds other than i, and xCfolds i, J contains the covariates from fold i. Loop through each of the folds, each time estimating Bridge i from the other 9 folds, and predicting y Bridge, i, where Xi is the matrix of predictors in the ith fold. Due: 3/02/2017 STAT 440: Homework 6 Once you finish looping through all 10 folds, predicting y, for each fold, you will have a full set of predictions for all of the observations in y. Now you can estimate the mean squared prediction error by i 1 and the standard error mseStep by Step Solution
There are 3 Steps involved in it
Step: 1

Get Instant Access to Expert-Tailored Solutions
See step-by-step solutions with expert insights and AI powered tools for academic success
Step: 2

Step: 3
Ace Your Homework with AI
Get the answers you need in no time with our AI-driven, step-by-step assistance
Get Started
Database Modeling And Design
Authors: Toby J. Teorey, Sam S. Lightstone, Tom Nadeau, H.V. Jagadish
5th Edition
0123820200, 978-0123820204