can someone pls help me doing this project using EXCEL ?
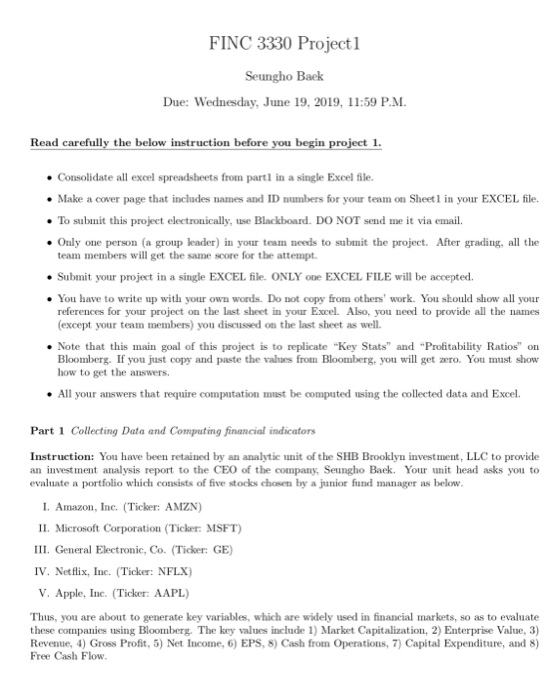
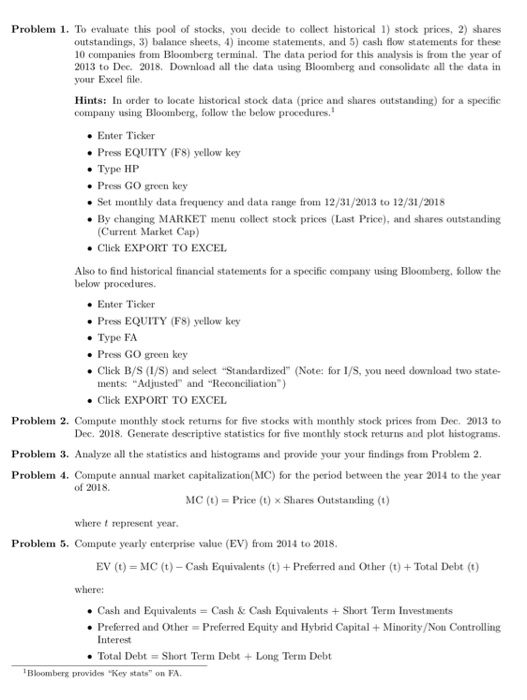
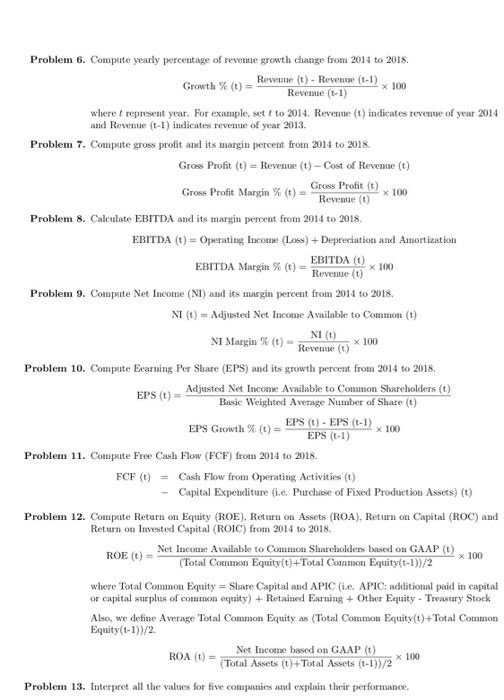
FINC 3330 Project1 Seungho Back Due: Wednesday, June 19, 2019, 11:59 P.M Read carefully the below instruction before you begin project 1. Consolidate all excel spreadsheets from part1 n a single Excel file Make a cover page that includes names and ID numbers for your team on Sheet1 in your EXCEL file. To submit this project electronically, use Blackboard. DO NOT send me it via email Only one person (a group leader) in your team needs to submit the project. After grading, all the team members will get the same score for the attempt Submit your project in a single EXCEL file. ONLY one EXCEL FILE will be accepted You have to write up with your own words. Do not copy from ot hers' work. You skould show all your references for your project on the last sheet in your Excel. Also, you need to provide all the names (except your team members) you discussed on the last sheet as well. Note that this main goal of this project is to replicate "Key Stats" and "Profitability Ratios" on Bloomberg. If you just copy and paste the values from Bloomberg, you will get zero. You must show how to get the answers. All your answers that require computation must be computed using the collected data and Excel. Part 1 Collecting Data and Computing financial indicators Instruction: You have been retained by an analytic unit of the SHB Brooklyn investment, LLC to provide an investment analysis report to the CEO of the company, Seungho Baek. Your unit head asks you to evaluate a portfolio which consists of five stocks chosen by a junior fund manager as below. I. Amazon, Inc. (Ticker: AMZN) II. Microsoft Corporation (Ticker: MSFT) III. General Electronic, Co. (Tidker: GE) IV. Netflix, Inc. (Ticker: NFLX) v. Apple, Inc. (Ticker: AAPL) Thus, you are about to generate key variables, which are widely used in financial markets, so as to evaluate these companies using Bloomberg. The key values include 1) Market Capitalization, 2) Enterprise Value, 3) Revenue, 4) Gross Profit, 5) Net Income, 6) EPS, 8) Cash from Operations, 7) Capital Expenditure, and 8) Free Cash Flow. Problem 1. To evaluate this pool of stocks, you decide to collect historical 1) stock prices, 2) shares outstandings, 3) balance sheets, 4) income statements, and 5) cash flow statements for these 10 companies from Bloomberg terminal. The data period for this analysis is from the year of 2013 to Dec. 2018. Download all the data using Bloomberg and consolidate all the data in your Excel file Hints: In order to locate historical stock data (price and shares outstanding) for a specific company using Bloomberg, follow the below procedures. Enter Ticker Press EQUITY (F8) yellow key P Press GO green key Set mont hly data frequency and data range from 12/31/2013 to 12/31/2018 By changing MARKET menu collect stock prices (Last Price), and shares outstanding (Current Market Cap) Click EXPORT TO EXCEL Also to find historical financial statements for a specific company using Bloomberg, follow the below procedures. Enter Ticker Press EQUITY (F8) yellow key . FA Pres GO green key Click B/S (I/S) and select "Standardized" (Note: for 1/S, you need download ments: "Adjusted" and "Reconciliation") Click EXPORT TO EXCEL two state- Problem 2. Compute monthly stock returns for five stocks with monthly stock prices from Dec. 2013 to Dec. 2018. Generate descriptive statistics for five monthly stock returns and plot histograms. Problem 3. Analyze all the statistics and histograms and provide your your findings from Problem 2. 1 Problem 4. Compute annual market capitalization (MC) for the period between the year 2014 to the year of 2018 MC (t) Price (t) x Shares Outstanding (t) where t represent year. Problem 5. Compute yearly enterprise value (EV) from 2014 to 2018 EV (t) MC (t)-Cash Equivalents (t)+Preferred and Other (t)+ Total Debt (t) where Cash and Equivalents = Cash& Cash Equivalents + Short Term Investments Preferred and Other= Preferred Equity and Hybrid Capital +Minority/Non Controlling Interest Total Debt =Short Term DebtLong Term Debt Bloomberg provides "Key stats" on FA Problem 6. Compate yearly percentage of revene growth change from 2014 to 2018 Revenue (t)- Revenue (t-1) Revemme (t-1) Growth % (t) x 100 where t represent year. For example, set t to 2014. Revenue (t) indicates revenue of year 2014 and Revenue (t-1) indicates revenue of year 2013. Problem 7. Compute gross profit and its margin percent from 2014 to 2018. Gross Profit (t) Revenue (t)-Cost of Revenue (t) Gross Profit (t) 100 Gross Profit Margin % (t) x Revemue (t) Problem 8. Calculate EBITDA and its margin percent from 2014 to 2018. EBITDA (t)Operating Income (Loss) +Depreciation and Amortization EBITDA (t) EBITDA Margin % (t) = Reveue (t) x 100 Problem 9. Compute Net Income (NI) and its margin percent from 2014 to 2018. NI (t)Adjusted Net Income Available to Common (t) NI (t) NI Margin % (t)Revemae (t) x 100 Problem 10. Compute Eearning Per Share (EPS) and its growth percent from 2014 to 2018. Adjusted Net Income Available to Common Shareholders (t) EPS (t) Basic Weighted Average Number of Share (t) EPS (t) EPS (t-1) EPS (t-1) EPS Growth % (t) = x 100 Problem 11. Compute Free Cash Flow (FCF) from 2014 to 2018. FCF (t) Cash Flow from Operating Activities (t) Capital Expenditure (i.e. Purchase of Fixed Production Assets) (t) Problem 12. Compate Return on Equity (ROE), Return on Assets (ROA), Return on Capital (ROC) and Return on Invested Capital (ROIC) from 2014 to 2018. ROE (t)Net Income Available to Common Shareholders based on GAAP (t) (Total Common Equity(t)+Total Common Equity(t-1))/2 x 100 where Total Common Equity Share Capital and APIC (ie. APIC: additional paid in capital or capital surplus of common equity) Retained EarningOther Equity Treasury Stock (Total Common Equity (t) + Total Common Also, we define Average Total Common Equity as Equity (t-1)/2. Net Income based on GAAP (t) Total Assets (t)+Total Assets (t-1))/2 ROA (t) x 100 Problem 13. Interpret all the values for five companies and explain their performance. FINC 3330 Project1 Seungho Back Due: Wednesday, June 19, 2019, 11:59 P.M Read carefully the below instruction before you begin project 1. Consolidate all excel spreadsheets from part1 n a single Excel file Make a cover page that includes names and ID numbers for your team on Sheet1 in your EXCEL file. To submit this project electronically, use Blackboard. DO NOT send me it via email Only one person (a group leader) in your team needs to submit the project. After grading, all the team members will get the same score for the attempt Submit your project in a single EXCEL file. ONLY one EXCEL FILE will be accepted You have to write up with your own words. Do not copy from ot hers' work. You skould show all your references for your project on the last sheet in your Excel. Also, you need to provide all the names (except your team members) you discussed on the last sheet as well. Note that this main goal of this project is to replicate "Key Stats" and "Profitability Ratios" on Bloomberg. If you just copy and paste the values from Bloomberg, you will get zero. You must show how to get the answers. All your answers that require computation must be computed using the collected data and Excel. Part 1 Collecting Data and Computing financial indicators Instruction: You have been retained by an analytic unit of the SHB Brooklyn investment, LLC to provide an investment analysis report to the CEO of the company, Seungho Baek. Your unit head asks you to evaluate a portfolio which consists of five stocks chosen by a junior fund manager as below. I. Amazon, Inc. (Ticker: AMZN) II. Microsoft Corporation (Ticker: MSFT) III. General Electronic, Co. (Tidker: GE) IV. Netflix, Inc. (Ticker: NFLX) v. Apple, Inc. (Ticker: AAPL) Thus, you are about to generate key variables, which are widely used in financial markets, so as to evaluate these companies using Bloomberg. The key values include 1) Market Capitalization, 2) Enterprise Value, 3) Revenue, 4) Gross Profit, 5) Net Income, 6) EPS, 8) Cash from Operations, 7) Capital Expenditure, and 8) Free Cash Flow. Problem 1. To evaluate this pool of stocks, you decide to collect historical 1) stock prices, 2) shares outstandings, 3) balance sheets, 4) income statements, and 5) cash flow statements for these 10 companies from Bloomberg terminal. The data period for this analysis is from the year of 2013 to Dec. 2018. Download all the data using Bloomberg and consolidate all the data in your Excel file Hints: In order to locate historical stock data (price and shares outstanding) for a specific company using Bloomberg, follow the below procedures. Enter Ticker Press EQUITY (F8) yellow key P Press GO green key Set mont hly data frequency and data range from 12/31/2013 to 12/31/2018 By changing MARKET menu collect stock prices (Last Price), and shares outstanding (Current Market Cap) Click EXPORT TO EXCEL Also to find historical financial statements for a specific company using Bloomberg, follow the below procedures. Enter Ticker Press EQUITY (F8) yellow key . FA Pres GO green key Click B/S (I/S) and select "Standardized" (Note: for 1/S, you need download ments: "Adjusted" and "Reconciliation") Click EXPORT TO EXCEL two state- Problem 2. Compute monthly stock returns for five stocks with monthly stock prices from Dec. 2013 to Dec. 2018. Generate descriptive statistics for five monthly stock returns and plot histograms. Problem 3. Analyze all the statistics and histograms and provide your your findings from Problem 2. 1 Problem 4. Compute annual market capitalization (MC) for the period between the year 2014 to the year of 2018 MC (t) Price (t) x Shares Outstanding (t) where t represent year. Problem 5. Compute yearly enterprise value (EV) from 2014 to 2018 EV (t) MC (t)-Cash Equivalents (t)+Preferred and Other (t)+ Total Debt (t) where Cash and Equivalents = Cash& Cash Equivalents + Short Term Investments Preferred and Other= Preferred Equity and Hybrid Capital +Minority/Non Controlling Interest Total Debt =Short Term DebtLong Term Debt Bloomberg provides "Key stats" on FA Problem 6. Compate yearly percentage of revene growth change from 2014 to 2018 Revenue (t)- Revenue (t-1) Revemme (t-1) Growth % (t) x 100 where t represent year. For example, set t to 2014. Revenue (t) indicates revenue of year 2014 and Revenue (t-1) indicates revenue of year 2013. Problem 7. Compute gross profit and its margin percent from 2014 to 2018. Gross Profit (t) Revenue (t)-Cost of Revenue (t) Gross Profit (t) 100 Gross Profit Margin % (t) x Revemue (t) Problem 8. Calculate EBITDA and its margin percent from 2014 to 2018. EBITDA (t)Operating Income (Loss) +Depreciation and Amortization EBITDA (t) EBITDA Margin % (t) = Reveue (t) x 100 Problem 9. Compute Net Income (NI) and its margin percent from 2014 to 2018. NI (t)Adjusted Net Income Available to Common (t) NI (t) NI Margin % (t)Revemae (t) x 100 Problem 10. Compute Eearning Per Share (EPS) and its growth percent from 2014 to 2018. Adjusted Net Income Available to Common Shareholders (t) EPS (t) Basic Weighted Average Number of Share (t) EPS (t) EPS (t-1) EPS (t-1) EPS Growth % (t) = x 100 Problem 11. Compute Free Cash Flow (FCF) from 2014 to 2018. FCF (t) Cash Flow from Operating Activities (t) Capital Expenditure (i.e. Purchase of Fixed Production Assets) (t) Problem 12. Compate Return on Equity (ROE), Return on Assets (ROA), Return on Capital (ROC) and Return on Invested Capital (ROIC) from 2014 to 2018. ROE (t)Net Income Available to Common Shareholders based on GAAP (t) (Total Common Equity(t)+Total Common Equity(t-1))/2 x 100 where Total Common Equity Share Capital and APIC (ie. APIC: additional paid in capital or capital surplus of common equity) Retained EarningOther Equity Treasury Stock (Total Common Equity (t) + Total Common Also, we define Average Total Common Equity as Equity (t-1)/2. Net Income based on GAAP (t) Total Assets (t)+Total Assets (t-1))/2 ROA (t) x 100 Problem 13. Interpret all the values for five companies and explain their performance