Can someone show me or type up how to do this on excel with necessary formulas?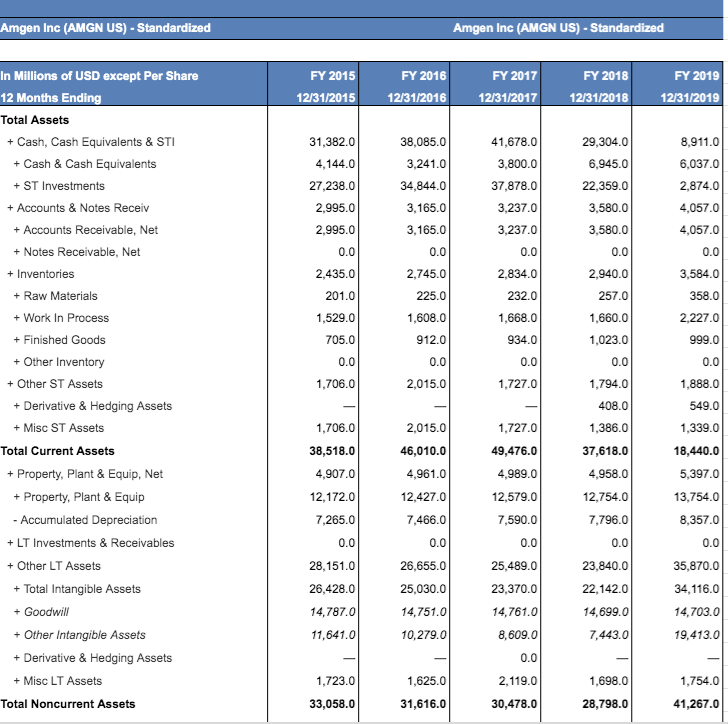
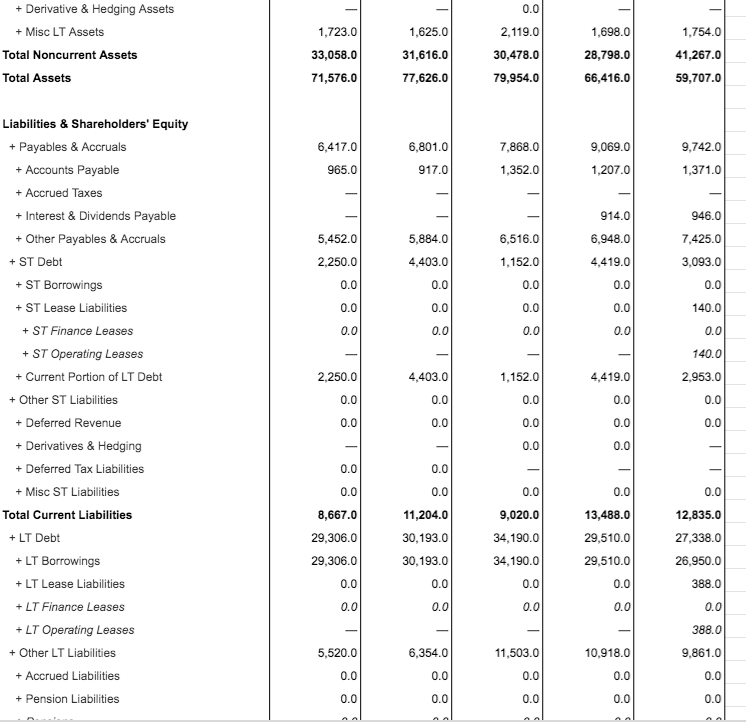
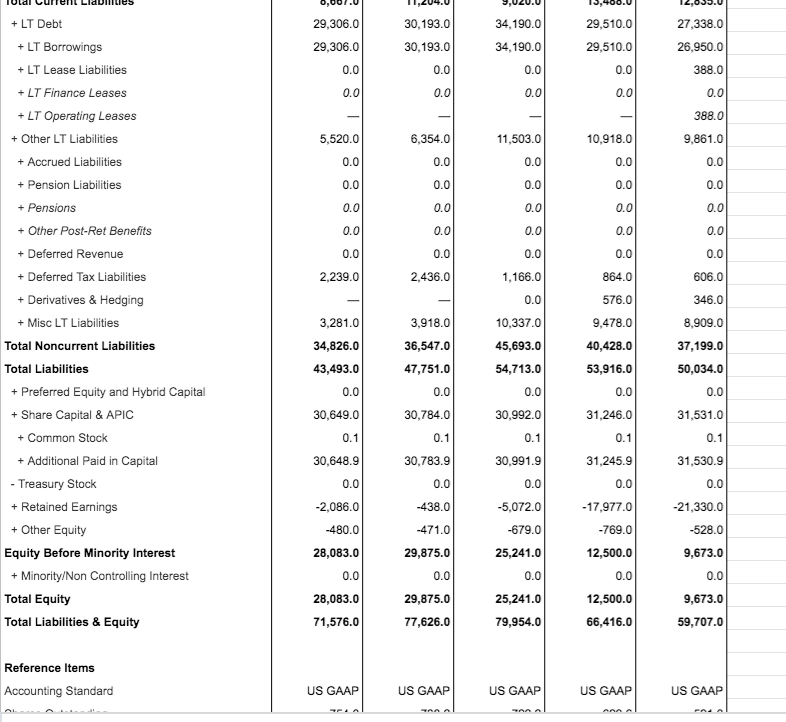
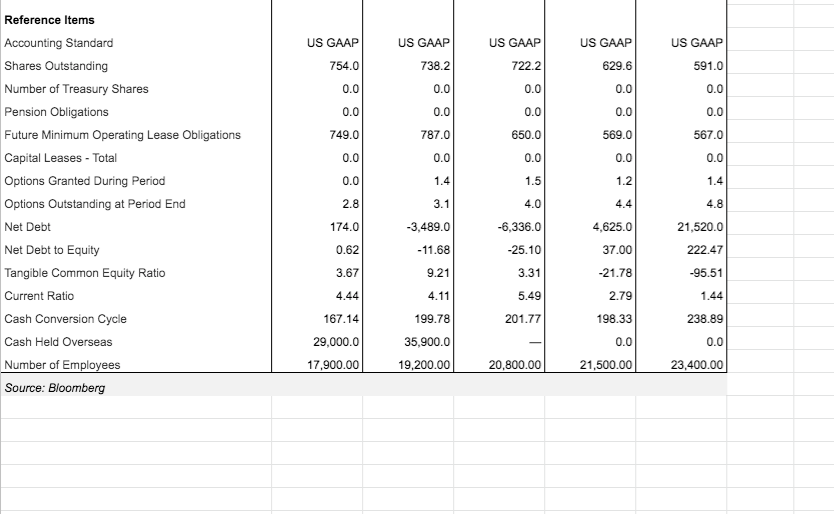
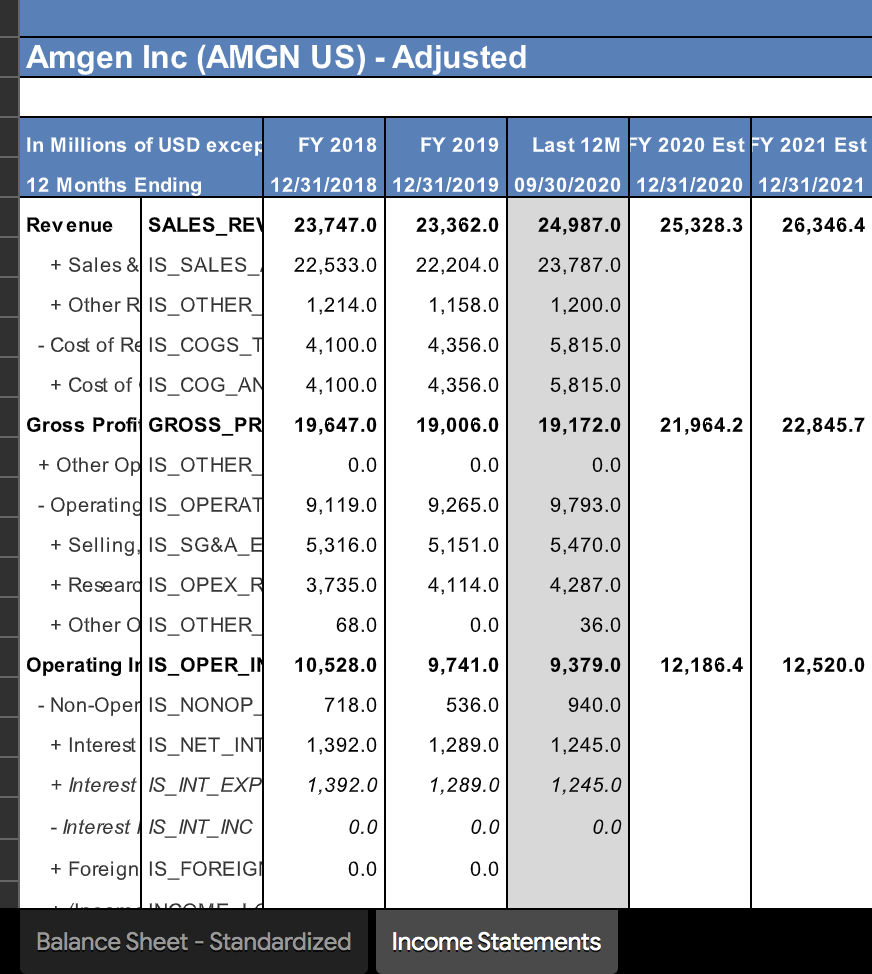
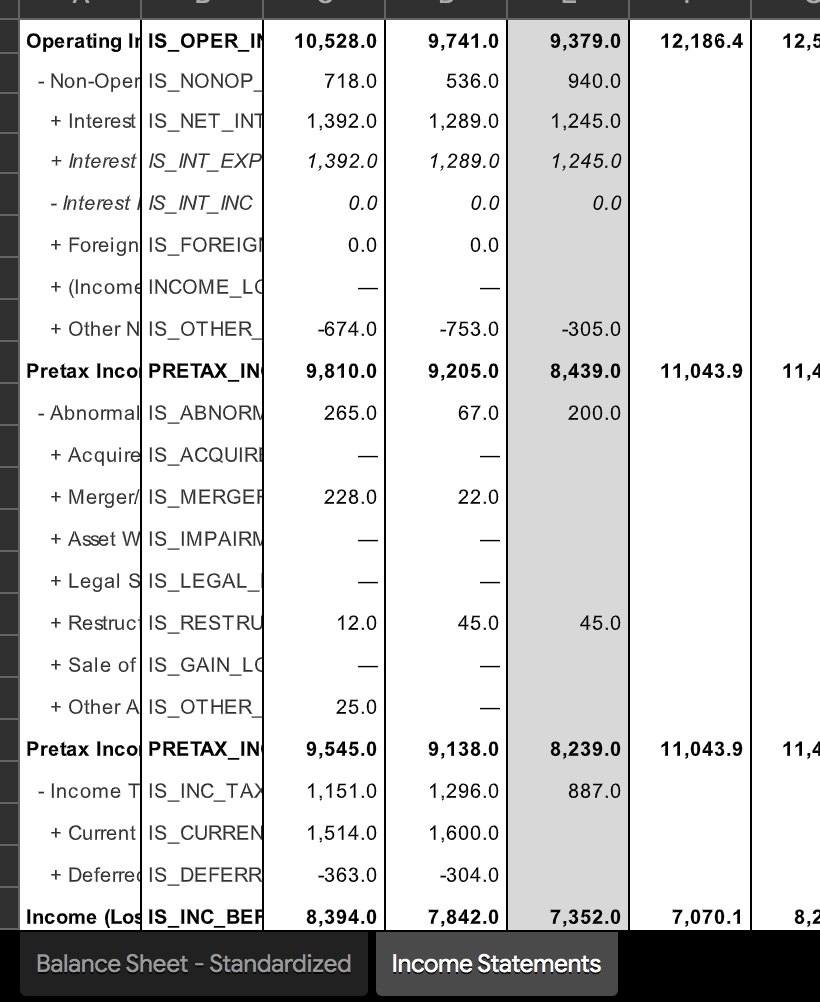
Amgen Inc (AMGN US) - Standardized Amgen Inc (AMGN US) - Standardized FY 2016 FY 2019 FY 2015 12/31/2015 FY 2017 12/31/2017 FY 2018 12/31/2018 12/31/2016 12/31/2019 31,382.0 4,144.0 27,238.0 2,995.0 2,995.0 38,085.0 3,241.0 34,844.0 3,165.0 3,165.0 41,678.0 3,800.0 37,878.0 3,237.0 3,237.0 29,304.0 6,945.0 22,359.0 3,580.0 3,580.0 8,911.0 6,037.0 2,874.0 4,057.0 4,057.0 0.0 0.0 0.0 0.0 0.0 3,584.0 2,435.0 201.0 1,529.0 358.0 2,834.0 232.0 1,668.0 934.0 2,745.0 225.0 1,608.0 912.0 0.0 2,015.0 2,940.0 257.0 1,660.0 1,023.0 2,227.0 705.0 999.0 0.0 0.0 0.0 0.0 In Millions of USD except Per Share 12 Months Ending Total Assets + Cash, Cash Equivalents & STI + Cash & Cash Equivalents + ST Investments + Accounts & Notes Receiv + Accounts Receivable, Net + Notes Receivable, Net + Inventories + Raw Materials + Work In Process + Finished Goods + Other Inventory + Other ST Assets + Derivative & Hedging Assets + Misc ST Assets Total Current Assets + Property, Plant & Equip, Net + Property, Plant & Equip - Accumulated Depreciation +LT Investments & Receivables + Other LT Assets + Total Intangible Assets + Goodwill + Other Intangible Assets + Derivative & Hedging Assets + Misc LT Assets Total Noncurrent Assets 1,706.0 1,727.0 1,888.0 549.0 1,339.0 1,706.0 38,518.0 4,907.0 12,172.0 7,265.0 18,440.0 1,794.0 408.0 1,386.0 37,618.0 4,958.0 12,754.0 7,796.0 1,727.0 49,476.0 4,989.0 12,579.0 7,590.0 5,397.0 2,015.0 46,010.0 4,961.0 12,427.0 7,466.0 0.0 26,655.0 25,030.0 14,751.0 10,279.00 13,754.0 8,357.0 0.0 0.0 0.0 0.0 28,151.0 26,428.0 14,787.0 11,641.0 25,489.0 23,370.0 14,761.00 8,609.0 23,840.0 22,142.0 14,699.0 7,443.0 35,870.0 34,116.0 14,703.0 19,413.0 0.0 1,723.0 1,754.0 1,625.0 31,616.0 2,119.0 30,478.0 1,698.0 28,798.0 33,058.0 41,267.0 0.0 1,723.0 1,754.0 + Derivative & Hedging Assets + Misc LT Assets Total Noncurrent Assets Total Assets 1,625.0 31,616.0 77,626.0 33,058.0 71,576.0 2,119.0 30,478.0 79,954.0 1,698.0 28,798.0 66,416.0 41,267.0 59,707.0 6,417.0 9,742.0 6,801.0 917.0 7,868.0 1,352.0 9,069.0 1,207.0 965.0 1,371.0 946.0 5,452.0 6,516.0 5,884.0 4,403.0 914.01 6,948.0 4,419.0 7,425.0 3,093.0 2,250.0 1,152.0 0.0 0.0 0.0 0.0 0.0 0.0 0.0 0.0 140.0 0.0 0.0 0.0 0.0 0.0 0.0 - 1 140.0 2.250.0 4,403.0 1,152.0 4,419.0 2,953.0 0.0 0.0 0.0 0.0 0.0 Liabilities & Shareholders' Equity + Payables & Accruals + Accounts Payable + Accrued Taxes + Interest & Dividends Payable + Other Payables & Accruals + ST Debt + ST Borrowings + ST Lease Liabilities + ST Finance Leases +ST Operating Leases + Current Portion of LT Debt + Other ST Liabilities + Deferred Revenue + Derivatives & Hedging + Deferred Tax Liabilities + Misc ST Liabilities Total Current Liabilities + LT Debt + LT Borrowings + LT Lease Liabilities +LT Finance Leases +LT Operating Leases + Other LT Liabilities + Accrued Liabilities + Pension Liabilities 0.0 0.0 0.0 0.0 0.0 - 0.0 0.0 1 0.0 0.0 0.0 0.0 0.0 0.0 0.0 12,835.0 8,667.0 29,306.0 29,306.0 11,204.0 30,193.0 30.193.0 0.0 9,020.01 34,190.0 34,190.0 27,338.0 13,488.0 29,510.0 29,510.0 0.0 0.0 26,950.0 0.0 0.0 388.0 0.0 0.0 0.0 0.0 - 388.0 5,520.0 6,354.0 11,503.0 10,918.0 9.861.0 0.0 0.0 0.0 0.0 0.0 0.0 0.0 0.0 0.0 0.0 A ,001.0 400.0 4,033.0 34,190.0 27,338.0 29,306.0 29,306.0 30,193.0 30,193.0 26,950.0 34,190.0 0.0 29,510.0 29,510.0 0.0 0.0 0.0 0.0 388.0 0.0 0.0 0.0 0.0 - 388.0 9,861.0 5,520.0 6,354.0 11,503.0 0.0 0.0 0.0 10,918.0 0.0 0.0 0.0 0.0 0.0 0.0 0.0 0.0 0.0 0.0 0.0 0.0 0.0 0.0 0.0 0.0 0.0 0.0 0.0 0.0 0.0 2,239.0 2,436.0 606.0 346.0 + LT Debt + LT Borrowings + LT Lease Liabilities +LT Finance Leases + LT Operating Leases + Other LT Liabilities + Accrued Liabilities + Pension Liabilities + Pensions + Other Post-Ret Benefits + Deferred Revenue + Deferred Tax Liabilities + Derivatives & Hedging + Misc LT Liabilities Total Noncurrent Liabilities Total Liabilities + Preferred Equity and Hybrid Capital + Share Capital & APIC + Common Stock + Additional Paid in Capital - Treasury Stock + Retained Earnings + Other Equity Equity Before Minority Interest + Minority/Non Controlling Interest Total Equity Total Liabilities & Equity 3,281.0 34,826.0 43,493.0 3,918.0 36,547.0 47,751.0 1,166.0 0.0 10,337.0 45,693.0 54,713.0 0.0 0.0 864.0 576.0 9,478.0 40,428.0 53,916.0 0.0 8,909.0 37,199.0 50,034.0 0.0 0.0 0.0 30,784.0 30,992.0 31,246.0 31,531.0 30,649.0 0.1 0.1 0.1 0.1 0.1 30,648.9 30,783.9 30,991.9 31,245.9 31,530.9 0.0 0.0 0.0 0.0 0.0 -21,330.0 -438.0 -471.0 29,875.0 -5,072.0 -679.0 25,241.0 -17,977.0 -769.0 12,500.0 -528.0 -2,086.0 -480.0 28,083.0 0.0 28,083.0 71,576.0 0.0 0.0 0.0 9,673.0 0.0 9,673.0 59,707.0 29,875.0 77,626.0 25,241.0 79,954.0 12,500.0 66,416.0 Reference Items Accounting Standard US GAAP US GAAP US GAAP US GAAP US GAAP US GAAP US GAAP US GAAP US GAAP 738.2 754.0 722.2 US GAAP 629.6 0.0 591.0 0.0 0.0 0.0 0.0 0.0 0.0 0.0 0.0 0.0 749.0 787.0 650.0 567.0 569.0 0.0 0.0 0.0 0.0 0.0 0.0 1.4 1.5 1.2 1.4 Reference Items Accounting Standard Shares Outstanding Number of Treasury Shares Pension Obligations Future Minimum Operating Lease Obligations Capital Leases - Total Options Granted During Period Options Outstanding at Period End Net Debt Net Debt to Equity Tangible Common Equity Ratio Current Ratio Cash Conversion Cycle Cash Held Overseas Number of Employees Source: Bloomberg 2.8 3.1 4.0 4.4 4.8 174.0 -3,489.0 -6,336.0 21,520.0 0.62 -11.68 -25.10 222.47 3.67 9.21 3.31 -95.51 4.44 4.11 4,625.0 37.00 -21.78 2.79 198.33 0.0 21,500.00 5.49 201.77 1.44 238.89 167.14 29,000.0 17,900.00 199.78 35,900.0 19,200.00 0.0 20,800.00 23,400.00 Amgen Inc (AMGN US) - Adjusted In Millions of USD excer FY 2018 FY 2019 Last 12M FY 2020 Est FY 2021 Est 12 Months Ending 12/31/2018 12/31/2019 09/30/2020 12/31/2020 12/31/2021 Revenue SALES_REV 23,747.0 23,362.0 24,987.0 25,328.3 26,346.4 + Sales & IS_SALES 22,533.0 22,204.0 23,787.0 + Other RIS_OTHER 1,158.0 1,200.0 1,214.0 4,100.0 - Cost of RIS_COGS_T 4,356.0 5,815.0 + Cost of IS_COG_AN 4,100.0 4,356.0 5,815.0 Gross Profi GROSS_PR 19,647.0 19,006.0 19,172.0 21,964.2 22,845.7 + Other Op IS_OTHER 0.0 0.0 0.0 - Operating is_OPERAT 9,119.0 9,265.0 9,793.0 + Selling. IS_SG&A_ 5,316.0 5,151.0 5,470.0 + Researd is_OPEX_R 3,735.0 4,114.0 4,287.0 + Other CIS_OTHER 68.0 0.0 36.0 Operating In Is_OPER_IN 10,528.0 9,741.0 9,379.0 12,186.4 12,520.0 - Non-Oper Is_NONOP 718.0 536.0 940.0 + Interest IS_NET_INT 1,392.0 1,289.0 1,245.0 + Interest | IS_INT_EXP 1,392.0 1,289.0 1,245.0 - Interest IS_INT_INC 0.0 0.0 0.0 + Foreign IS_FOREIGI 0.0 0.0 Balance Sheet - Standardized Income Statements Operating IIS_OPER_IN 10,528.0 9,741.0 9,379.0 12,186.4 12,5 - Non-Oper IS_NONOP 718.0 536.0 940.0 1,392.0 1,289.0 1,245.0 + Interest IS_NET_INT + Interest | IS_INT_EXP 1,392.0 1,289.0 1,245.0 - Interest IS_INT_INC 0.0 0.0 0.0 + Foreign IS_FOREIGI 0.0 0.0 + (Income INCOME_LO + Other N IS OTHER -674.0 -753.0 -305.0 Pretax Inco PRETAX_IN 9,810.0 9,205.0 8,439.0 11,043.9 11,4 - Abnormal IS_ABNORN 265.0 67.0 200.0 + Acquire IS_ACQUIR - - + Merger Is_MERGE 228.0 22.0 + Asset WIS_IMPAIRN - - + Legal SIS_LEGAL - - + Restruc IS_RESTRU 12.0 45.0 45.0 + Sale of IS_GAIN_L + Other Al Is_OTHER 25.0 Pretax Inco PRETAX_IN 9,545.0 9,138.0 8,239.0 11,043.9 11,4 - Income TIS_INC_TAY 1,151.0 1,296.0 887.0 + Current IS CURREN 1,514.0 1,600.0 Deferred IS_DEFERR -363.0 -304.0 Income (Los IS_INC_BEF 8,394.0 7,842.0 7,352.0 7,070.1 8,2 Balance Sheet - Standardized Income Statements Instructions: 1) Using the S&P 500 stock assigned to you, export to Excel the corporation's Balance Sheet and Income Statement using Bloomberg Terminals. Make certain to cut and paste the Income Statement onto a second worksheet in the same file as the Balance Sheet. 2) Delete columns except for the name of the accounts and the last two complete (and audited) Fiscal Years in order to perform Financial Statement Analyses as follows. 3) Perform Vertical Analysis for both the Balance Sheet and the Income Statement of the two most recent Calendar or Fiscal Years per your corresponding corporation, for example, 12-31-18 and 12-31-19 if the corporation utilizing the calendar year as its Fiscal Year. Make certain to insert a column between the two years in order to perform Vertical Analysis for the previous year. 4) Perform Horizontal Analysis for both the Balance Sheet and Income Statement determining both Dollar Change and Percentage Change. In regard to the Income Statement, consider Net Income as "Income (Loss) from Continuing Operations. Also, delete any cells with non-values, such as #VALUE! and #DIV/0!. 5) On another work sheet, perform Ratio Analysis in order to determine the following values: A) Gross Profit Margin; B) Net Profit Margin; C) Return on Assets; D) Current Ratio; E) Debt to Equity Ratio; and F) Total Asset Turnover. 6) Make certain to label the page tabs appropriately. Amgen Inc (AMGN US) - Standardized Amgen Inc (AMGN US) - Standardized FY 2016 FY 2019 FY 2015 12/31/2015 FY 2017 12/31/2017 FY 2018 12/31/2018 12/31/2016 12/31/2019 31,382.0 4,144.0 27,238.0 2,995.0 2,995.0 38,085.0 3,241.0 34,844.0 3,165.0 3,165.0 41,678.0 3,800.0 37,878.0 3,237.0 3,237.0 29,304.0 6,945.0 22,359.0 3,580.0 3,580.0 8,911.0 6,037.0 2,874.0 4,057.0 4,057.0 0.0 0.0 0.0 0.0 0.0 3,584.0 2,435.0 201.0 1,529.0 358.0 2,834.0 232.0 1,668.0 934.0 2,745.0 225.0 1,608.0 912.0 0.0 2,015.0 2,940.0 257.0 1,660.0 1,023.0 2,227.0 705.0 999.0 0.0 0.0 0.0 0.0 In Millions of USD except Per Share 12 Months Ending Total Assets + Cash, Cash Equivalents & STI + Cash & Cash Equivalents + ST Investments + Accounts & Notes Receiv + Accounts Receivable, Net + Notes Receivable, Net + Inventories + Raw Materials + Work In Process + Finished Goods + Other Inventory + Other ST Assets + Derivative & Hedging Assets + Misc ST Assets Total Current Assets + Property, Plant & Equip, Net + Property, Plant & Equip - Accumulated Depreciation +LT Investments & Receivables + Other LT Assets + Total Intangible Assets + Goodwill + Other Intangible Assets + Derivative & Hedging Assets + Misc LT Assets Total Noncurrent Assets 1,706.0 1,727.0 1,888.0 549.0 1,339.0 1,706.0 38,518.0 4,907.0 12,172.0 7,265.0 18,440.0 1,794.0 408.0 1,386.0 37,618.0 4,958.0 12,754.0 7,796.0 1,727.0 49,476.0 4,989.0 12,579.0 7,590.0 5,397.0 2,015.0 46,010.0 4,961.0 12,427.0 7,466.0 0.0 26,655.0 25,030.0 14,751.0 10,279.00 13,754.0 8,357.0 0.0 0.0 0.0 0.0 28,151.0 26,428.0 14,787.0 11,641.0 25,489.0 23,370.0 14,761.00 8,609.0 23,840.0 22,142.0 14,699.0 7,443.0 35,870.0 34,116.0 14,703.0 19,413.0 0.0 1,723.0 1,754.0 1,625.0 31,616.0 2,119.0 30,478.0 1,698.0 28,798.0 33,058.0 41,267.0 0.0 1,723.0 1,754.0 + Derivative & Hedging Assets + Misc LT Assets Total Noncurrent Assets Total Assets 1,625.0 31,616.0 77,626.0 33,058.0 71,576.0 2,119.0 30,478.0 79,954.0 1,698.0 28,798.0 66,416.0 41,267.0 59,707.0 6,417.0 9,742.0 6,801.0 917.0 7,868.0 1,352.0 9,069.0 1,207.0 965.0 1,371.0 946.0 5,452.0 6,516.0 5,884.0 4,403.0 914.01 6,948.0 4,419.0 7,425.0 3,093.0 2,250.0 1,152.0 0.0 0.0 0.0 0.0 0.0 0.0 0.0 0.0 140.0 0.0 0.0 0.0 0.0 0.0 0.0 - 1 140.0 2.250.0 4,403.0 1,152.0 4,419.0 2,953.0 0.0 0.0 0.0 0.0 0.0 Liabilities & Shareholders' Equity + Payables & Accruals + Accounts Payable + Accrued Taxes + Interest & Dividends Payable + Other Payables & Accruals + ST Debt + ST Borrowings + ST Lease Liabilities + ST Finance Leases +ST Operating Leases + Current Portion of LT Debt + Other ST Liabilities + Deferred Revenue + Derivatives & Hedging + Deferred Tax Liabilities + Misc ST Liabilities Total Current Liabilities + LT Debt + LT Borrowings + LT Lease Liabilities +LT Finance Leases +LT Operating Leases + Other LT Liabilities + Accrued Liabilities + Pension Liabilities 0.0 0.0 0.0 0.0 0.0 - 0.0 0.0 1 0.0 0.0 0.0 0.0 0.0 0.0 0.0 12,835.0 8,667.0 29,306.0 29,306.0 11,204.0 30,193.0 30.193.0 0.0 9,020.01 34,190.0 34,190.0 27,338.0 13,488.0 29,510.0 29,510.0 0.0 0.0 26,950.0 0.0 0.0 388.0 0.0 0.0 0.0 0.0 - 388.0 5,520.0 6,354.0 11,503.0 10,918.0 9.861.0 0.0 0.0 0.0 0.0 0.0 0.0 0.0 0.0 0.0 0.0 A ,001.0 400.0 4,033.0 34,190.0 27,338.0 29,306.0 29,306.0 30,193.0 30,193.0 26,950.0 34,190.0 0.0 29,510.0 29,510.0 0.0 0.0 0.0 0.0 388.0 0.0 0.0 0.0 0.0 - 388.0 9,861.0 5,520.0 6,354.0 11,503.0 0.0 0.0 0.0 10,918.0 0.0 0.0 0.0 0.0 0.0 0.0 0.0 0.0 0.0 0.0 0.0 0.0 0.0 0.0 0.0 0.0 0.0 0.0 0.0 0.0 0.0 2,239.0 2,436.0 606.0 346.0 + LT Debt + LT Borrowings + LT Lease Liabilities +LT Finance Leases + LT Operating Leases + Other LT Liabilities + Accrued Liabilities + Pension Liabilities + Pensions + Other Post-Ret Benefits + Deferred Revenue + Deferred Tax Liabilities + Derivatives & Hedging + Misc LT Liabilities Total Noncurrent Liabilities Total Liabilities + Preferred Equity and Hybrid Capital + Share Capital & APIC + Common Stock + Additional Paid in Capital - Treasury Stock + Retained Earnings + Other Equity Equity Before Minority Interest + Minority/Non Controlling Interest Total Equity Total Liabilities & Equity 3,281.0 34,826.0 43,493.0 3,918.0 36,547.0 47,751.0 1,166.0 0.0 10,337.0 45,693.0 54,713.0 0.0 0.0 864.0 576.0 9,478.0 40,428.0 53,916.0 0.0 8,909.0 37,199.0 50,034.0 0.0 0.0 0.0 30,784.0 30,992.0 31,246.0 31,531.0 30,649.0 0.1 0.1 0.1 0.1 0.1 30,648.9 30,783.9 30,991.9 31,245.9 31,530.9 0.0 0.0 0.0 0.0 0.0 -21,330.0 -438.0 -471.0 29,875.0 -5,072.0 -679.0 25,241.0 -17,977.0 -769.0 12,500.0 -528.0 -2,086.0 -480.0 28,083.0 0.0 28,083.0 71,576.0 0.0 0.0 0.0 9,673.0 0.0 9,673.0 59,707.0 29,875.0 77,626.0 25,241.0 79,954.0 12,500.0 66,416.0 Reference Items Accounting Standard US GAAP US GAAP US GAAP US GAAP US GAAP US GAAP US GAAP US GAAP US GAAP 738.2 754.0 722.2 US GAAP 629.6 0.0 591.0 0.0 0.0 0.0 0.0 0.0 0.0 0.0 0.0 0.0 749.0 787.0 650.0 567.0 569.0 0.0 0.0 0.0 0.0 0.0 0.0 1.4 1.5 1.2 1.4 Reference Items Accounting Standard Shares Outstanding Number of Treasury Shares Pension Obligations Future Minimum Operating Lease Obligations Capital Leases - Total Options Granted During Period Options Outstanding at Period End Net Debt Net Debt to Equity Tangible Common Equity Ratio Current Ratio Cash Conversion Cycle Cash Held Overseas Number of Employees Source: Bloomberg 2.8 3.1 4.0 4.4 4.8 174.0 -3,489.0 -6,336.0 21,520.0 0.62 -11.68 -25.10 222.47 3.67 9.21 3.31 -95.51 4.44 4.11 4,625.0 37.00 -21.78 2.79 198.33 0.0 21,500.00 5.49 201.77 1.44 238.89 167.14 29,000.0 17,900.00 199.78 35,900.0 19,200.00 0.0 20,800.00 23,400.00 Amgen Inc (AMGN US) - Adjusted In Millions of USD excer FY 2018 FY 2019 Last 12M FY 2020 Est FY 2021 Est 12 Months Ending 12/31/2018 12/31/2019 09/30/2020 12/31/2020 12/31/2021 Revenue SALES_REV 23,747.0 23,362.0 24,987.0 25,328.3 26,346.4 + Sales & IS_SALES 22,533.0 22,204.0 23,787.0 + Other RIS_OTHER 1,158.0 1,200.0 1,214.0 4,100.0 - Cost of RIS_COGS_T 4,356.0 5,815.0 + Cost of IS_COG_AN 4,100.0 4,356.0 5,815.0 Gross Profi GROSS_PR 19,647.0 19,006.0 19,172.0 21,964.2 22,845.7 + Other Op IS_OTHER 0.0 0.0 0.0 - Operating is_OPERAT 9,119.0 9,265.0 9,793.0 + Selling. IS_SG&A_ 5,316.0 5,151.0 5,470.0 + Researd is_OPEX_R 3,735.0 4,114.0 4,287.0 + Other CIS_OTHER 68.0 0.0 36.0 Operating In Is_OPER_IN 10,528.0 9,741.0 9,379.0 12,186.4 12,520.0 - Non-Oper Is_NONOP 718.0 536.0 940.0 + Interest IS_NET_INT 1,392.0 1,289.0 1,245.0 + Interest | IS_INT_EXP 1,392.0 1,289.0 1,245.0 - Interest IS_INT_INC 0.0 0.0 0.0 + Foreign IS_FOREIGI 0.0 0.0 Balance Sheet - Standardized Income Statements Operating IIS_OPER_IN 10,528.0 9,741.0 9,379.0 12,186.4 12,5 - Non-Oper IS_NONOP 718.0 536.0 940.0 1,392.0 1,289.0 1,245.0 + Interest IS_NET_INT + Interest | IS_INT_EXP 1,392.0 1,289.0 1,245.0 - Interest IS_INT_INC 0.0 0.0 0.0 + Foreign IS_FOREIGI 0.0 0.0 + (Income INCOME_LO + Other N IS OTHER -674.0 -753.0 -305.0 Pretax Inco PRETAX_IN 9,810.0 9,205.0 8,439.0 11,043.9 11,4 - Abnormal IS_ABNORN 265.0 67.0 200.0 + Acquire IS_ACQUIR - - + Merger Is_MERGE 228.0 22.0 + Asset WIS_IMPAIRN - - + Legal SIS_LEGAL - - + Restruc IS_RESTRU 12.0 45.0 45.0 + Sale of IS_GAIN_L + Other Al Is_OTHER 25.0 Pretax Inco PRETAX_IN 9,545.0 9,138.0 8,239.0 11,043.9 11,4 - Income TIS_INC_TAY 1,151.0 1,296.0 887.0 + Current IS CURREN 1,514.0 1,600.0 Deferred IS_DEFERR -363.0 -304.0 Income (Los IS_INC_BEF 8,394.0 7,842.0 7,352.0 7,070.1 8,2 Balance Sheet - Standardized Income Statements Instructions: 1) Using the S&P 500 stock assigned to you, export to Excel the corporation's Balance Sheet and Income Statement using Bloomberg Terminals. Make certain to cut and paste the Income Statement onto a second worksheet in the same file as the Balance Sheet. 2) Delete columns except for the name of the accounts and the last two complete (and audited) Fiscal Years in order to perform Financial Statement Analyses as follows. 3) Perform Vertical Analysis for both the Balance Sheet and the Income Statement of the two most recent Calendar or Fiscal Years per your corresponding corporation, for example, 12-31-18 and 12-31-19 if the corporation utilizing the calendar year as its Fiscal Year. Make certain to insert a column between the two years in order to perform Vertical Analysis for the previous year. 4) Perform Horizontal Analysis for both the Balance Sheet and Income Statement determining both Dollar Change and Percentage Change. In regard to the Income Statement, consider Net Income as "Income (Loss) from Continuing Operations. Also, delete any cells with non-values, such as #VALUE! and #DIV/0!. 5) On another work sheet, perform Ratio Analysis in order to determine the following values: A) Gross Profit Margin; B) Net Profit Margin; C) Return on Assets; D) Current Ratio; E) Debt to Equity Ratio; and F) Total Asset Turnover. 6) Make certain to label the page tabs appropriately