can you answer numbers 8-12 please. use statkey
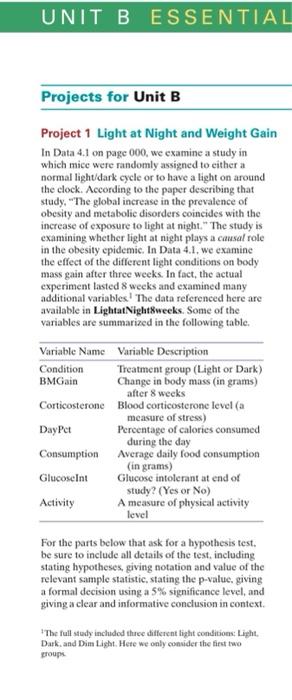
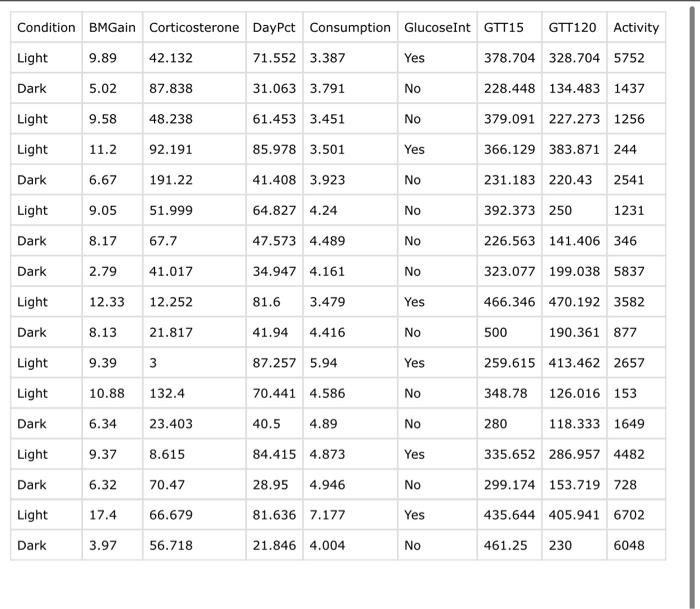
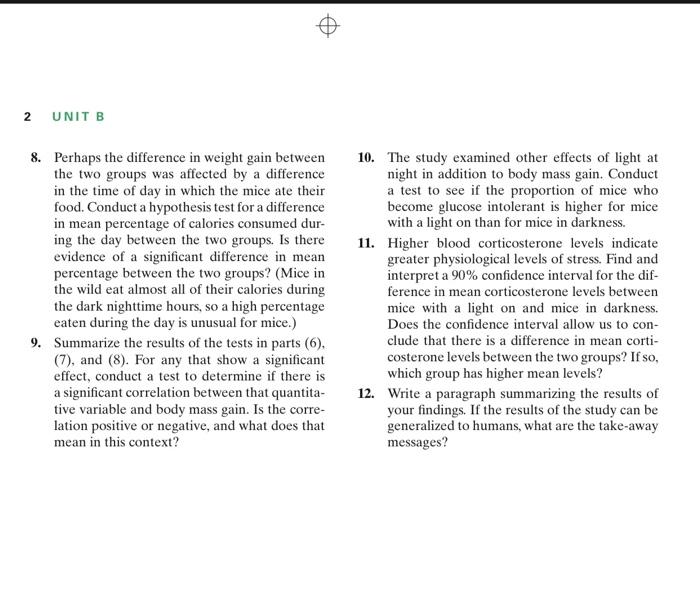
Condition BMGain Corticosterone DayPct Consumption GlucoseInt GTT15 GTT120 Activity Light 9.89 42.132 71.552 3.387 Yes 378.704 328.704 5752 Dark 5.02 87.838 31.063 3.791 No 228.448 134.483 1437 Light 9.58 48.238 61.453 3.451 No 379.091 227.273 1256 Light 11.2 92.191 85.978 3.501 Yes 366.129 383.871 244 Dark 6.67 191.22 41.408 3.923 No 231.183 220.43 2541 Light 9.05 51.999 64.827 4.24 No 392.373 250 1231 Dark 8.17 67.7 47.573 4.489 No 226.563 141.406 346 Dark 2.79 41.017 34.947 4.161 No 323.077 199.038 5837 Light 12.33 12.252 81.6 3.479 Yes 466.346 470.192 3582 Dark 8.13 21.817 41.94 4.416 No 500 190.361 877 Light 9.39 3 87.257 5.94 Yes 259.615 413.462 2657 Light 10.88 132.4 70.441 4.586 No 348.78 126.016 153 Dark 6.34 23.403 40.5 4.89 No 280 118.333 1649 Light 9.37 8.615 84.415 4.873 Yes 335.652 286.957 4482 Dark 6.32 70.47 28.95 4.946 NO 299.174 153.719 728 Light 17.4 66.679 81.636 7.177 Yes 435.644 405.941 6702 Dark 3.97 56.718 21.846 4.004 No 461.25 230 6048 2 UNIT B 8. Perhaps the difference in weight gain between the two groups was affected by a difference in the time of day in which the mice ate their food. Conduct a hypothesis test for a difference in mean percentage of calories consumed dur- ing the day between the two groups. Is there evidence of a significant difference in mean percentage between the two groups? (Mice in the wild eat almost all of their calories during the dark nighttime hours, so a high percentage eaten during the day is unusual for mice.) 9. Summarize the results of the tests in parts (6), (7), and (8). For any that show a significant effect, conduct a test to determine if there is a significant correlation between that quantita- tive variable and body mass gain. Is the corre- lation positive or negative, and what does that mean in this context? 10. The study examined other effects of light at night in addition to body mass gain. Conduct a test to see if the proportion of mice who become glucose intolerant is higher for mice with a light on than for mice in darkness. 11. Higher blood corticosterone levels indicate greater physiological levels of stress. Find and interpret a 90% confidence interval for the dif- ference in mean corticosterone levels between mice with a light on and mice in darkness. Does the confidence interval allow us to con- clude that there is a difference in mean corti- costerone levels between the two groups? If so, which group has higher mean levels? 12. Write a paragraph summarizing the results of your findings. If the results of the study can be generalized to humans, what are the take-away messages? UNIT B ESSENTIAL Projects for Unit B Project 1 Light at Night and Weight Gain In Data 4.1 on page 000, we examine a study in which mice were randomly assigned to either a normal light/dark cycle or to have a light on around the clock. According to the paper describing that study, "The global increase in the prevalence of obesity and metabolic disorders coincides with the increase of exposure to light at night. The study is examining whether light at night plays a causal role in the obesity epidemic. In Data 4.1. we examine the effect of the different light conditions on body mass gain after three weeks. In fact, the actual experiment lasted 8 weeks and examined many additional variables. The data referenced here are available in Lightat Night8weeks. Some of the variables are summarized in the following table. Variable Name Variable Description Condition Treatment group (Light or Dark) BMGain Change in body mass (in grams) after 8 weeks Corticosterone Blood corticosterone level (a measure of stress) DayPet Percentage of calories consumed during the day Consumption Average daily food consumption (in grams) Glucoseint Glucose intolerant at end of study? (Yes or No) Activity A measure of physical activity level For the parts below that ask for a hypothesis test. be sure to include all details of the test, including stating hypotheses, giving notation and value of the relevant sample statistic stating the p-value giving a formal decision using a 5% significance level, and giving a clear and informative conclusion in context The full study included three different light conditions: Light Dark and Dim Light. Here we only consider the first two groups Condition BMGain Corticosterone DayPct Consumption GlucoseInt GTT15 GTT120 Activity Light 9.89 42.132 71.552 3.387 Yes 378.704 328.704 5752 Dark 5.02 87.838 31.063 3.791 No 228.448 134.483 1437 Light 9.58 48.238 61.453 3.451 No 379.091 227.273 1256 Light 11.2 92.191 85.978 3.501 Yes 366.129 383.871 244 Dark 6.67 191.22 41.408 3.923 No 231.183 220.43 2541 Light 9.05 51.999 64.827 4.24 No 392.373 250 1231 Dark 8.17 67.7 47.573 4.489 No 226.563 141.406 346 Dark 2.79 41.017 34.947 4.161 No 323.077 199.038 5837 Light 12.33 12.252 81.6 3.479 Yes 466.346 470.192 3582 Dark 8.13 21.817 41.94 4.416 No 500 190.361 877 Light 9.39 3 87.257 5.94 Yes 259.615 413.462 2657 Light 10.88 132.4 70.441 4.586 No 348.78 126.016 153 Dark 6.34 23.403 40.5 4.89 No 280 118.333 1649 Light 9.37 8.615 84.415 4.873 Yes 335.652 286.957 4482 Dark 6.32 70.47 28.95 4.946 NO 299.174 153.719 728 Light 17.4 66.679 81.636 7.177 Yes 435.644 405.941 6702 Dark 3.97 56.718 21.846 4.004 No 461.25 230 6048 2 UNIT B 8. Perhaps the difference in weight gain between the two groups was affected by a difference in the time of day in which the mice ate their food. Conduct a hypothesis test for a difference in mean percentage of calories consumed dur- ing the day between the two groups. Is there evidence of a significant difference in mean percentage between the two groups? (Mice in the wild eat almost all of their calories during the dark nighttime hours, so a high percentage eaten during the day is unusual for mice.) 9. Summarize the results of the tests in parts (6), (7), and (8). For any that show a significant effect, conduct a test to determine if there is a significant correlation between that quantita- tive variable and body mass gain. Is the corre- lation positive or negative, and what does that mean in this context? 10. The study examined other effects of light at night in addition to body mass gain. Conduct a test to see if the proportion of mice who become glucose intolerant is higher for mice with a light on than for mice in darkness. 11. Higher blood corticosterone levels indicate greater physiological levels of stress. Find and interpret a 90% confidence interval for the dif- ference in mean corticosterone levels between mice with a light on and mice in darkness. Does the confidence interval allow us to con- clude that there is a difference in mean corti- costerone levels between the two groups? If so, which group has higher mean levels? 12. Write a paragraph summarizing the results of your findings. If the results of the study can be generalized to humans, what are the take-away messages? UNIT B ESSENTIAL Projects for Unit B Project 1 Light at Night and Weight Gain In Data 4.1 on page 000, we examine a study in which mice were randomly assigned to either a normal light/dark cycle or to have a light on around the clock. According to the paper describing that study, "The global increase in the prevalence of obesity and metabolic disorders coincides with the increase of exposure to light at night. The study is examining whether light at night plays a causal role in the obesity epidemic. In Data 4.1. we examine the effect of the different light conditions on body mass gain after three weeks. In fact, the actual experiment lasted 8 weeks and examined many additional variables. The data referenced here are available in Lightat Night8weeks. Some of the variables are summarized in the following table. Variable Name Variable Description Condition Treatment group (Light or Dark) BMGain Change in body mass (in grams) after 8 weeks Corticosterone Blood corticosterone level (a measure of stress) DayPet Percentage of calories consumed during the day Consumption Average daily food consumption (in grams) Glucoseint Glucose intolerant at end of study? (Yes or No) Activity A measure of physical activity level For the parts below that ask for a hypothesis test. be sure to include all details of the test, including stating hypotheses, giving notation and value of the relevant sample statistic stating the p-value giving a formal decision using a 5% significance level, and giving a clear and informative conclusion in context The full study included three different light conditions: Light Dark and Dim Light. Here we only consider the first two groups


 can you answer numbers 8-12 please. use statkey


