can you answer the questions down below, its 8 questions that follow each other


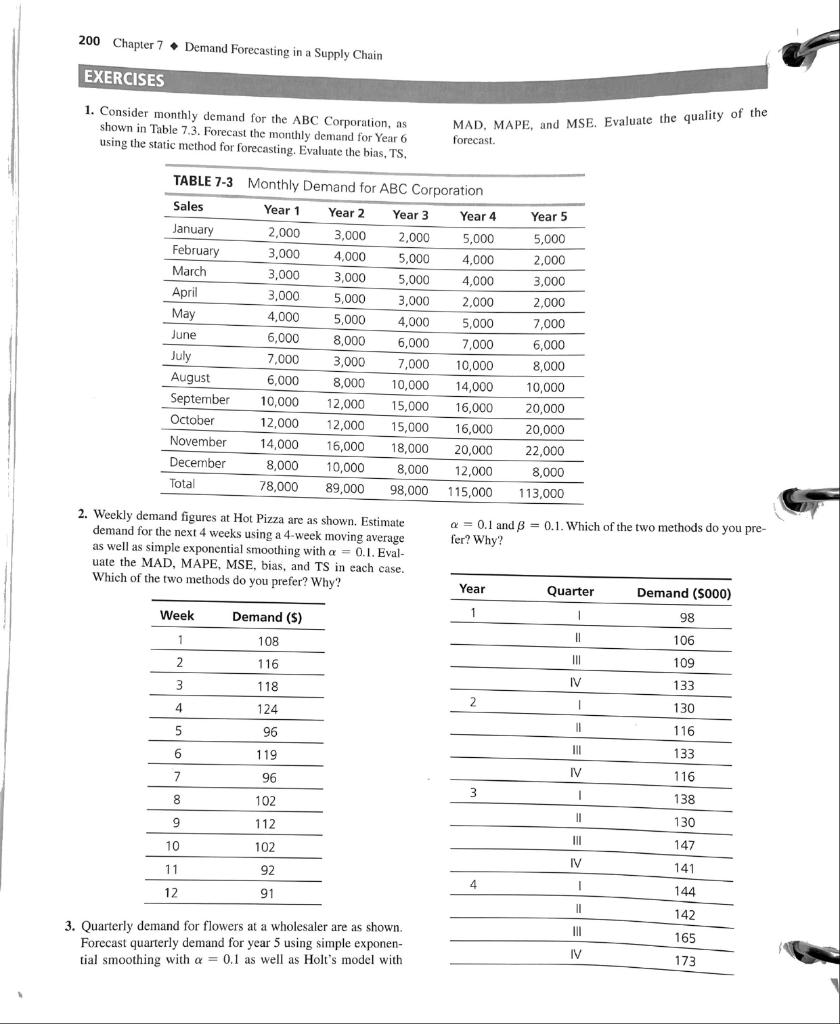
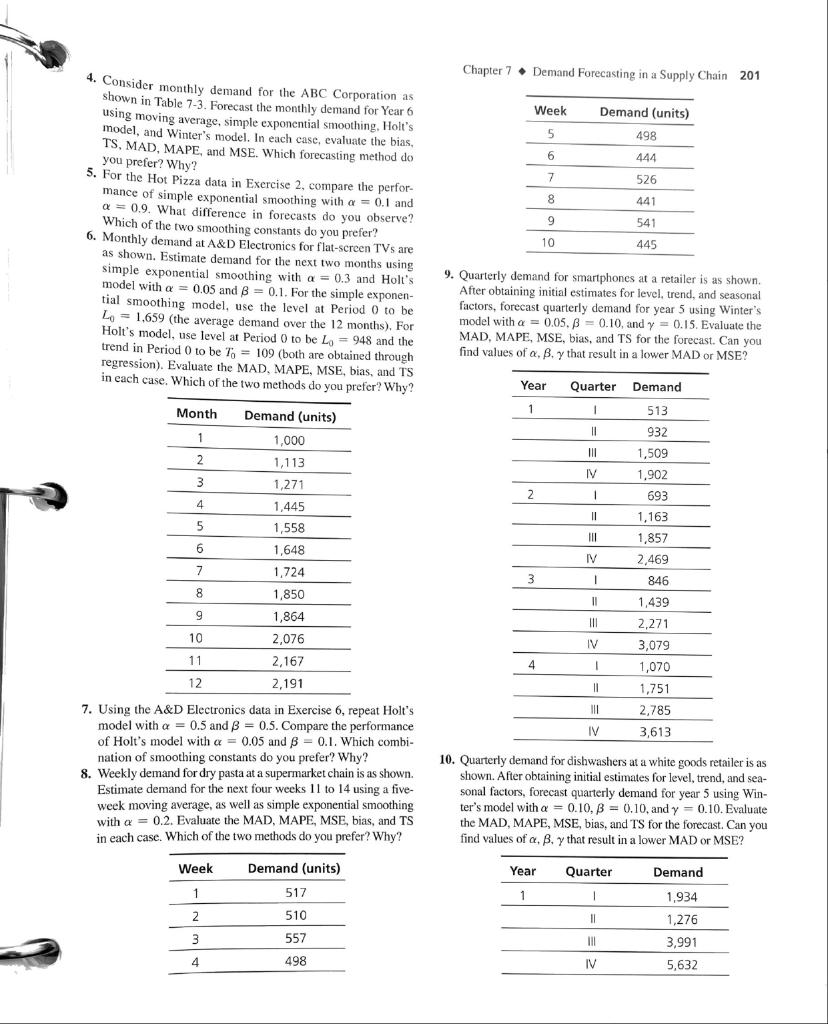
1. Consider monthly demand for the ABC Corporation, as shown in Table 7.3. Forecast the monthly demand for Year 6 MAD, MAPE, and MSE. Evaluate the quality of the using the static method for forecasting. Evaluate the bias, TS, forecast. 2. Weekly demand figures at Hot Pizza are as shown. Estimate =0.1 and =0.1. Which of the two methods do you predemand for the next 4 weeks using a 4 -week moving average fer? Why? as well as simple exponential smoothing with =0.1. Evaluate the MAD, MAPE, MSE, bias, and TS in each case. Which of the two methods do you prefer? Why? 3. Quarterly demand for flowers at a wholesaler are as shown. Forecast quarterly demand for year 5 using simple exponential smoothing with =0.1 as well as Holt's model with 4. Consider monthly demand for the ABC Corporation as Chapter 7 Demand Forecasting in a Supply Chain 201 shown in Table 7-3. Forecast the monthly demand for Year 6 using moving average, simple exponential smoothing, Holt's model, and Winter's model. In each case, evaluate the bias, TS, MAD, MAPE, and MSE. Which forecasting method do you prefer? Why? 5. For the Hot Pizza data in Exercise 2, compare the performance of simple exponential smoothing with =0.1 and =0.9. What difference in forecasts do you observe? Which of the two smoothing constants do you prefer? 6. Monthly demand at A\&D Electronics for flat-screen TVs are as shown. Estimate demand for the next two months using simple exponential smoothing with =0.3 and Holt's 9. Quarterly demand for smartphones at a retailer is as shown. Holt's model, use level at Period 0 to be L0=948 and the MAD, MAPE, MSE, bias, and TS for the forecast. Can you trend in Period 0 to be T0=109 (both are obtained through find values of ,, that result in a lower MAD or MSE? regression). Evaluate the MAD, MAPE, MSE, bias, and TS in each case. Which of the two methods do you prefer? Why? \begin{tabular}{cc} \hline Month & Demand (units) \\ \hline 1 & 1,000 \\ \hline 2 & 1,113 \\ \hline 3 & 1,271 \\ \hline 4 & 1,445 \\ \hline 5 & 1,558 \\ \hline 6 & 1,648 \\ \hline 7 & 1,724 \\ \hline 8 & 1,850 \\ \hline 9 & 1,864 \\ \hline 10 & 2,076 \\ \hline 11 & 2,167 \\ \hline 12 & 2,191 \\ \hline \end{tabular} 7. Using the A\&D Electronics data in Exercise 6, repeat Holt's model with =0.5 and =0.5. Compare the performance of Holt's model with =0.05 and =0.1. Which combi- \begin{tabular}{ccc} \hline Year & Quarter & Demand \\ \hline 1 & 1 & 513 \\ \hline & & 932 \\ \hline & III & 1,509 \\ \hline & N & 1,902 \\ \hline 2 & 1 & 693 \\ \hline & II & 1,163 \\ \hline & III & 1,857 \\ \hline 3 & N & 2,469 \\ \hline & 1 & 846 \\ \hline & & 1,439 \\ \hline & II & 2,271 \\ \hline 4 & V & 3,079 \\ \hline & 1 & 1,070 \\ \hline & & 1,751 \\ \hline & II & 2,785 \\ \hline & N & 3,613 \\ \hline \end{tabular} nation of smoothing constants do you prefer? Why? 10. Quarterly demand for dishwashers at a white goods retailer is as 8. Weekly demand for dry pasta at a supermarket chain is as shown. Estimate demand for the next four weeks 11 to 14 using a five-_sown. After obtaining initial estimates for level, trend, and seaweek moving average, as well as simple exponential smoothing sonalfactors,forecastquarterlydemandforyear5usingWin-tersmodelwith=0.10,=0.10,and=0.10.Evaluate with =0.2. Evaluate the MAD, MAPE, MSE, bias, and TS the MAD, MAPE, MSE, bias, and TS for the forecast. Can you in each case. Which of the two methods do you prefer? Why? find values of ,, that result in a lower MAD or MSE? \begin{tabular}{cc} \hline Week & Demand (units) \\ \hline 1 & 517 \\ \hline 2 & 510 \\ \hline 3 & 557 \\ \hline 4 & 498 \\ \hline \end{tabular} \begin{tabular}{ccc} \hline Year & Quarter & Demand \\ \hline 1 & 1 & 1,934 \\ \hline & I & 1,276 \\ \hline & 111 & 3,991 \\ \hline N & 5,632 \\ \hline \end{tabular}


