Answered step by step
Verified Expert Solution
Link Copied!

Question

1 Approved Answer

Can you explain every questions clear ? Project - The Gini Index The goal of this project is to see an application of definite integrals

Can you explain every questions clear ?
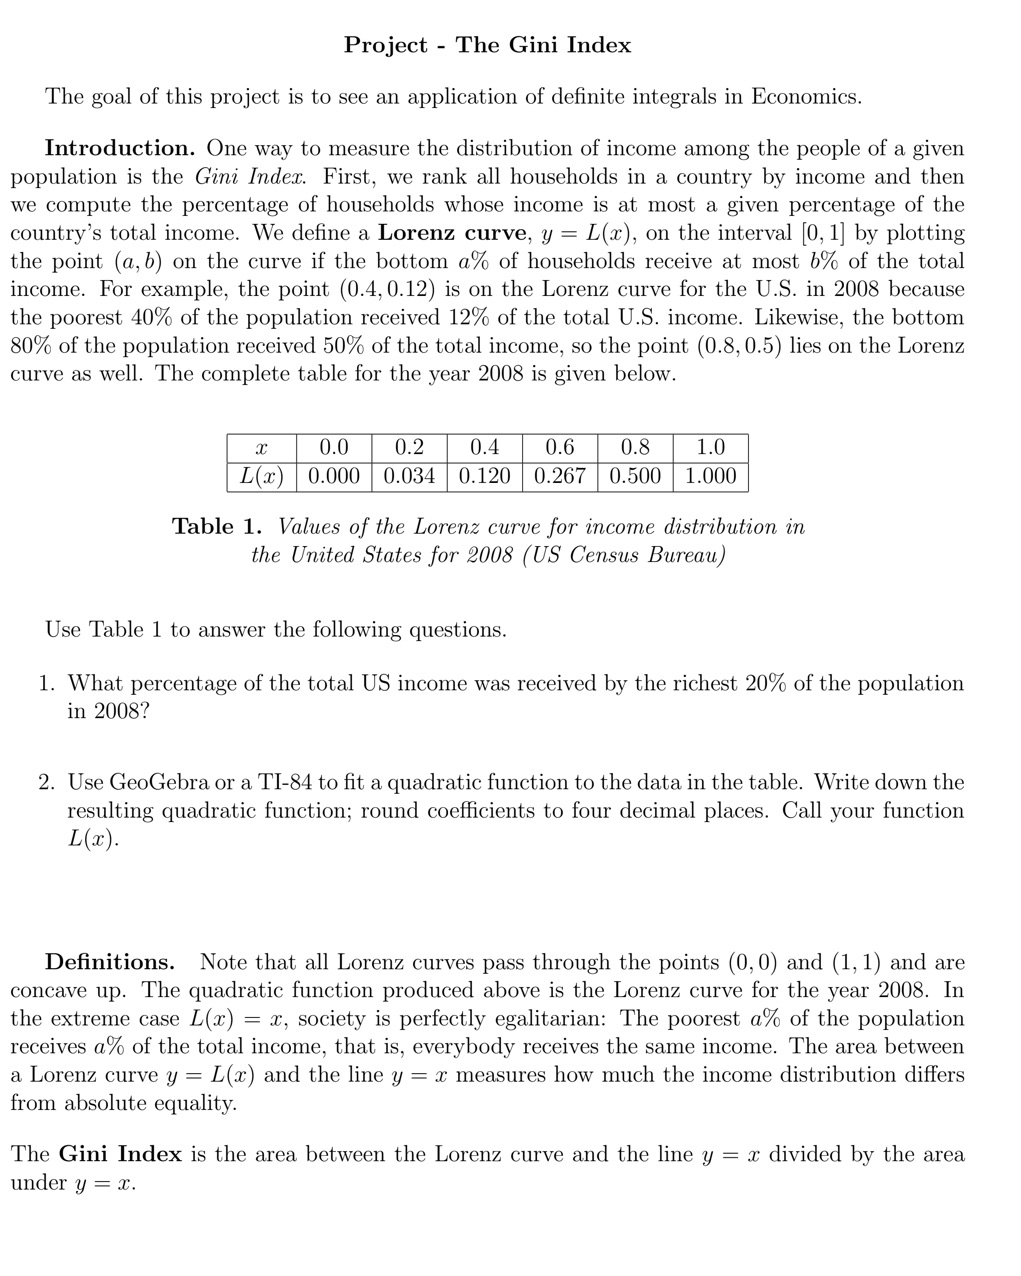
image text in transcribed
Project - The Gini Index The goal of this project is to see an application of definite integrals in Economics. Introduction. One way to measure the distribution of income among the people of a given population is the Gini Index. First, we rank all households in a country by income and then we compute the percentage of households whose income is at most a given percentage of the country's total income. We define a Lorenz curve, y = L(x), on the interval [0, 1] by plotting the point (a, b) on the curve if the bottom a% of households receive at most b% of the total income. For example, the point (0.4, 0.12) is on the Lorenz curve for the U.S. in 2008 because the poorest 40% of the population received 12% of the total U.S. income. Likewise, the bottom 80% of the population received 50% of the total income, so the point (0.8, 0.5) lies on the Lorenz curve as well. The complete table for the year 2008 is given below. 0.0 0.2 0.4 0.6 0.8 1.0 L(x) 0.000 0.034 0.120 0.267 0.500 1.000 Table 1. Values of the Lorenz curve for income distribution in the United States for 2008 (US Census Bureau) Use Table 1 to answer the following questions. 1. What percentage of the total US income was received by the richest 20% of the population in 2008? 2. Use GeoGebra or a TI-84 to fit a quadratic function to the data in the table. Write down the resulting quadratic function; round coefficients to four decimal places. Call your function L(x). Definitions. Note that all Lorenz curves pass through the points (0, 0) and (1, 1) and are concave up. The quadratic function produced above is the Lorenz curve for the year 2008. In the extreme case L(x) = x, society is perfectly egalitarian: The poorest a of the population receives a% of the total income, that is, everybody receives the same income. The area between a Lorenz curve y = L(x) and the line y = x measures how much the income distribution differs from absolute equality. The Gini Index is the area between the Lorenz curve and the line y = x divided by the area under y = x

Step by Step Solution

There are 3 Steps involved in it

Step: 1

blur-text-image

Get Instant Access to Expert-Tailored Solutions

See step-by-step solutions with expert insights and AI powered tools for academic success

Step: 2

blur-text-image

Step: 3

blur-text-image

Ace Your Homework with AI

Get the answers you need in no time with our AI-driven, step-by-step assistance

Get Started

Recommended Textbook for

Making Hard Decisions with decision tools

Authors: Robert Clemen, Terence Reilly

3rd edition

538797576, 978-0538797573

More Books

Students also viewed these Mathematics questions

Question

Describe the differences between multinational and global firms.

Answered: 1 week ago

Question

Identify the various sources of external funds in a supply chain

Answered: 1 week ago